Mastering PKOs With Custom Aggregated Reports


Overview
In this article, I will introduce one of our most unique innovations in what poker tools have to offer: Custom Aggregated Reports (CAR). They enable you to generate solutions for all strategically distinct flops with just a single action, while still having the freedom of {{tooltip-title: the AI configuration options}} you’re used to. The question now is, “How to use these reports for improving, and when are they preferable over simply running a single hand through the AI?”
{{tooltip-content: the AI configuration options}}
– Editable ranges
– Custom stack, pot, and bet sizes
– Payouts and bounties
– Etc.
{{/tooltip-content}}
We will be following the scientific method to validate some assumptions regarding the ways PKO strategies diverge from regular ICM. However, we need to first ensure we understand the tool that will yield our data, so we start by taking a look at how CAR works. Then define two key assumptions about how general flop strategy changes in a PKO relative to classic ICM. Finally, we will generate two reports of identical flop spots, where the only significant difference is the game format. They will allow us to determine whether the assumptions hold and whether there are heuristics to take into our PKO games going forward.
About Custom Aggregated Reports
Before proceeding with this article, I would recommend reviewing how Custom Aggregated Reports work. The linked write-up explains, among other things, what Power Credits are and which configurations are available before generating a given report. The overall takeaway is that you can now easily define a spot using our AI solver and produce a snapshot of every flop node without having to ‘guess and check’ different flop textures.
The most powerful application of this functionality is the comparison of the big pictures containing all flops to see how changing a specific variable changes the general strategy. This is particularly helpful for comparing Classic and PKO solutions to see how the addition of bounties impacts our flop strategy both as a covered and covering player.
Pro tip: Prior to producing custom reports, it is a good idea to run a few specific flop textures manually through the AI to pretest assumptions. If they hold in that small set of samples, generating a report to automate the solving process across all flops will enable you to confirm whether your assumption can be applied as a general heuristic. However, if you are able to disprove your assumption without a report, you can avoid spending Power Credits unnecessarily.
Hypotheses
In another article, I formulated a number of hypotheses on what changed our preflop PKO ranges. Factors such as positions, stack depth, and bounty size. We were able to identify which of these factors had the greatest impact on ranges by isolating each variable and showing at an aggregate level how changing each of them affected our overall range.
We will repeat this process, but in this case, we will do it for postflop variables. Specifically, we will test the following three hypotheses:
- The covering player uses larger flop bet sizes in a PKO to increase the likelihood of being all-in by the river.
- The covered player raises flop less often with low-equity hands in a PKO because the covering player folds fewer hands.
- The covered player will call flop all-ins wider in a PKO due to their reduced Risk Premium (RP) when there is a wider gap between Classic and PKO RPs.
To find out more about applying the scientific method to poker, there is a coaching session dedicated to it by Tombos21.
Report Details
To test these hypotheses, we will be running two reports: one for a Classic ICM environment and an identical report for a PKO ICM setting. We will be looking at solutions that include the criteria needed to test our assumptions, specifically:
The following two solutions from our library meet these requirements:
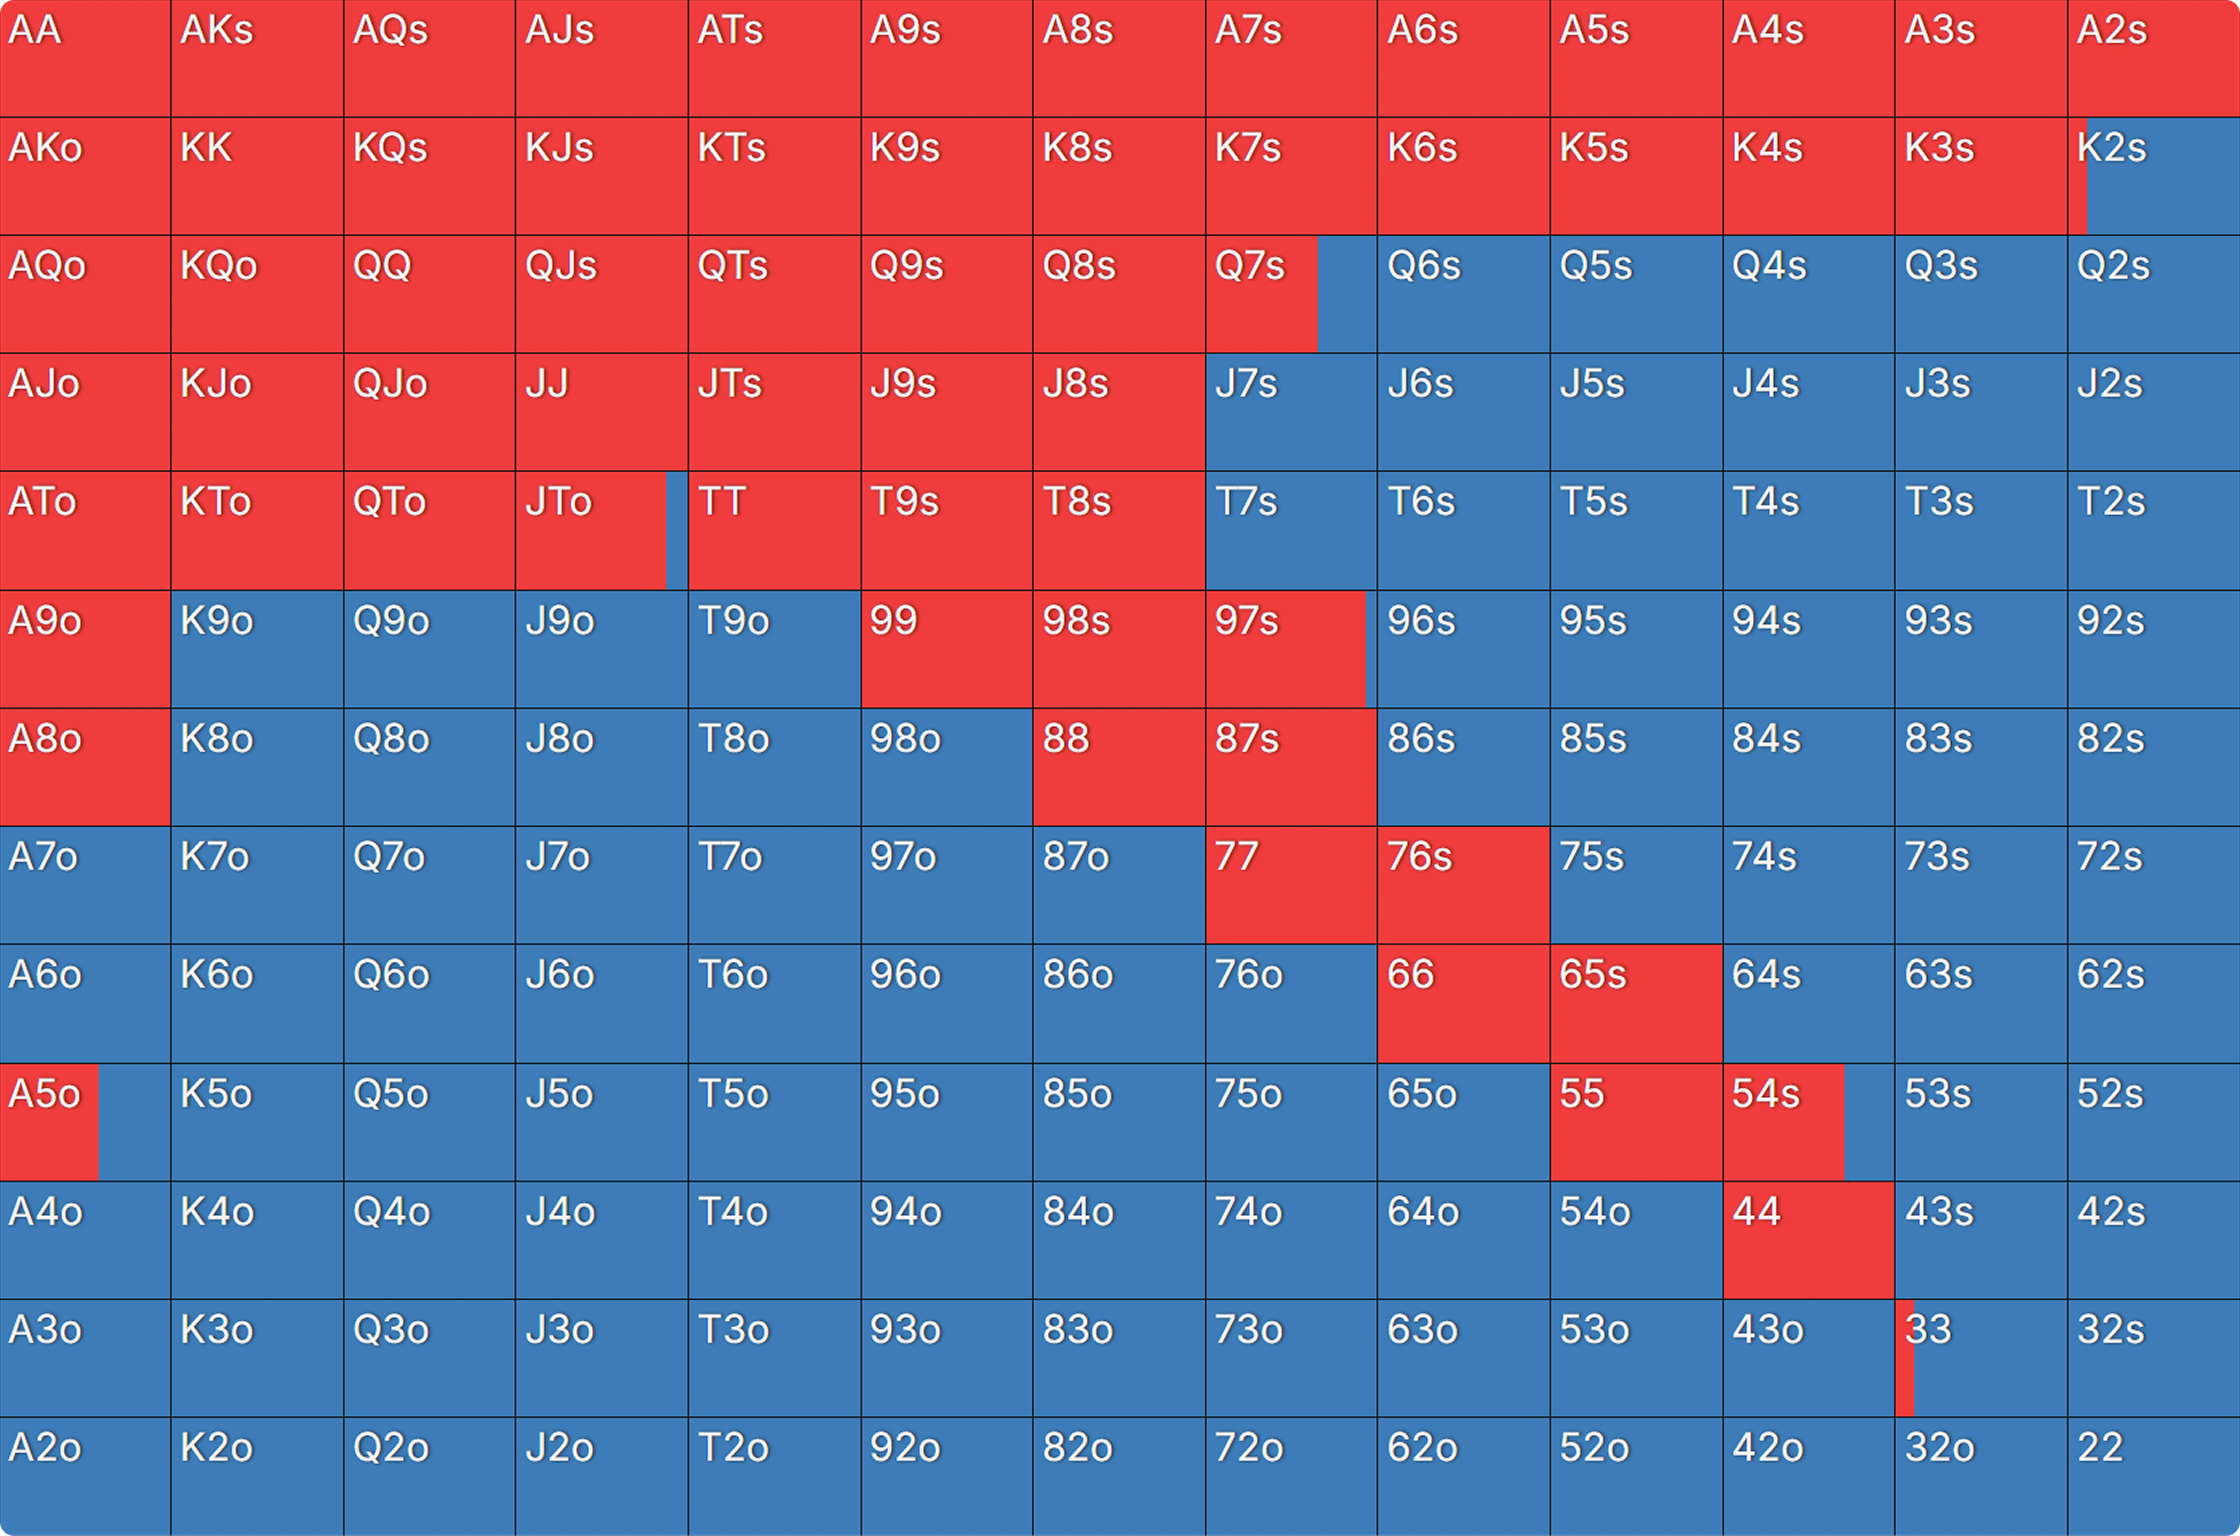
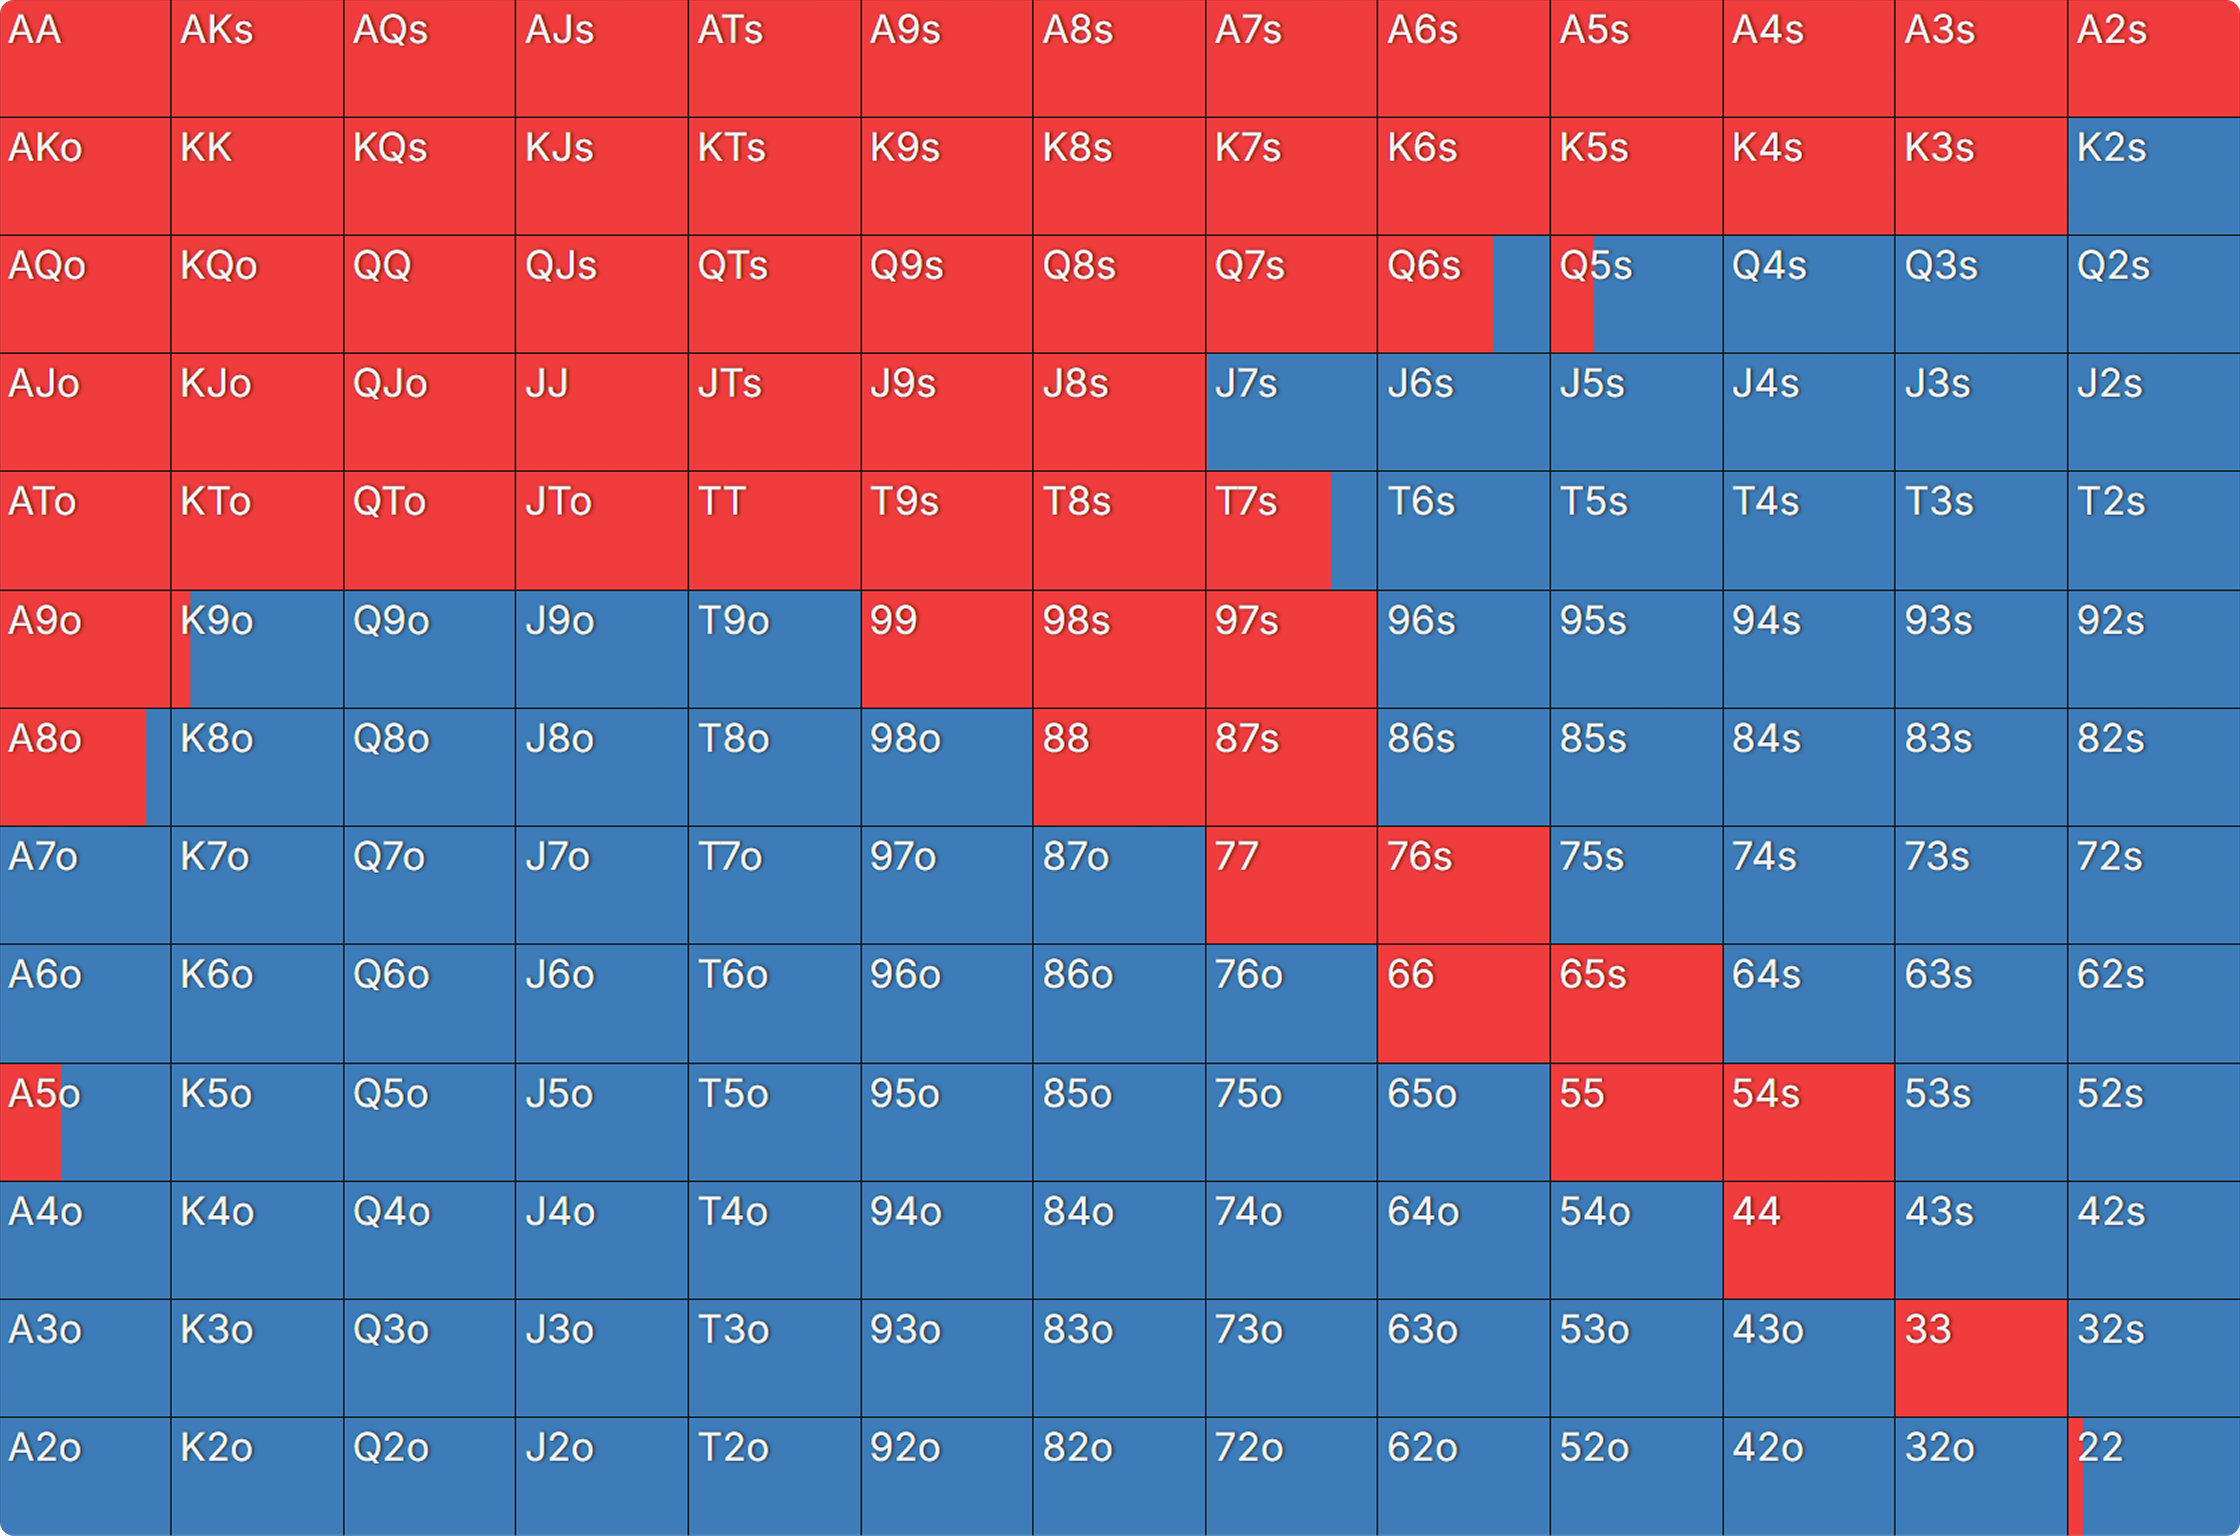
We will look at a single-raised pot where the biggest stack (UTG+1) opens and is called by the Button.
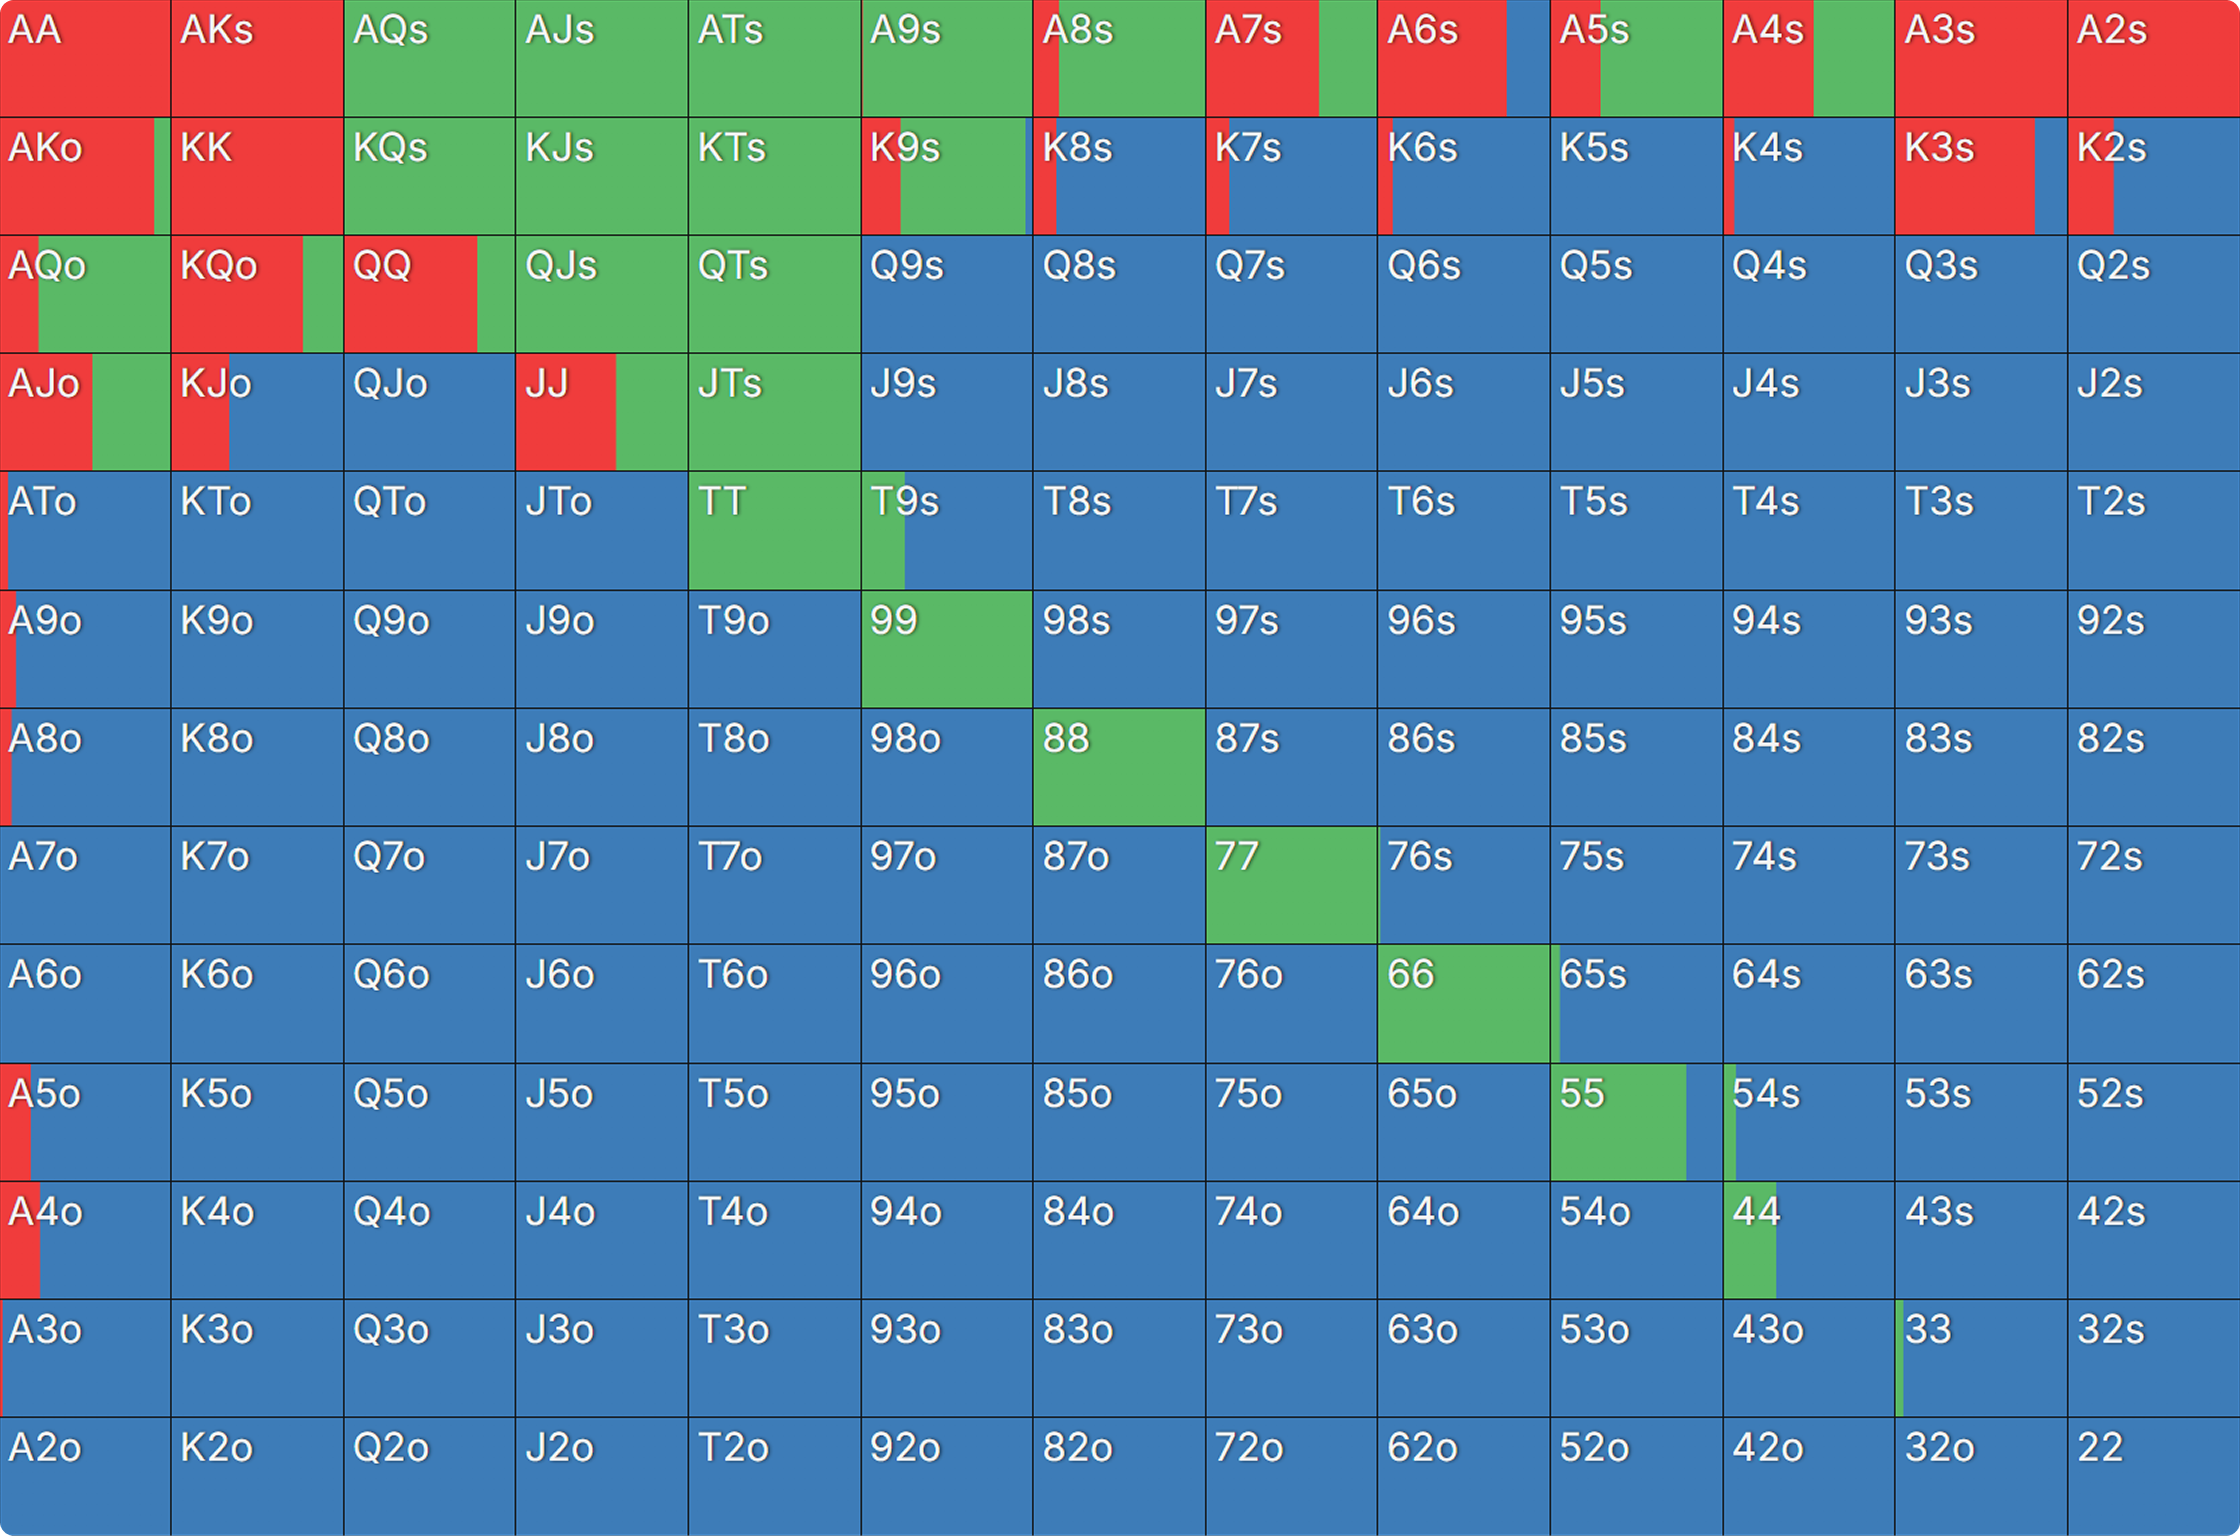
UTG+1 Preflop Opening Strategies
{{grid: 2}}
{{/grid}}
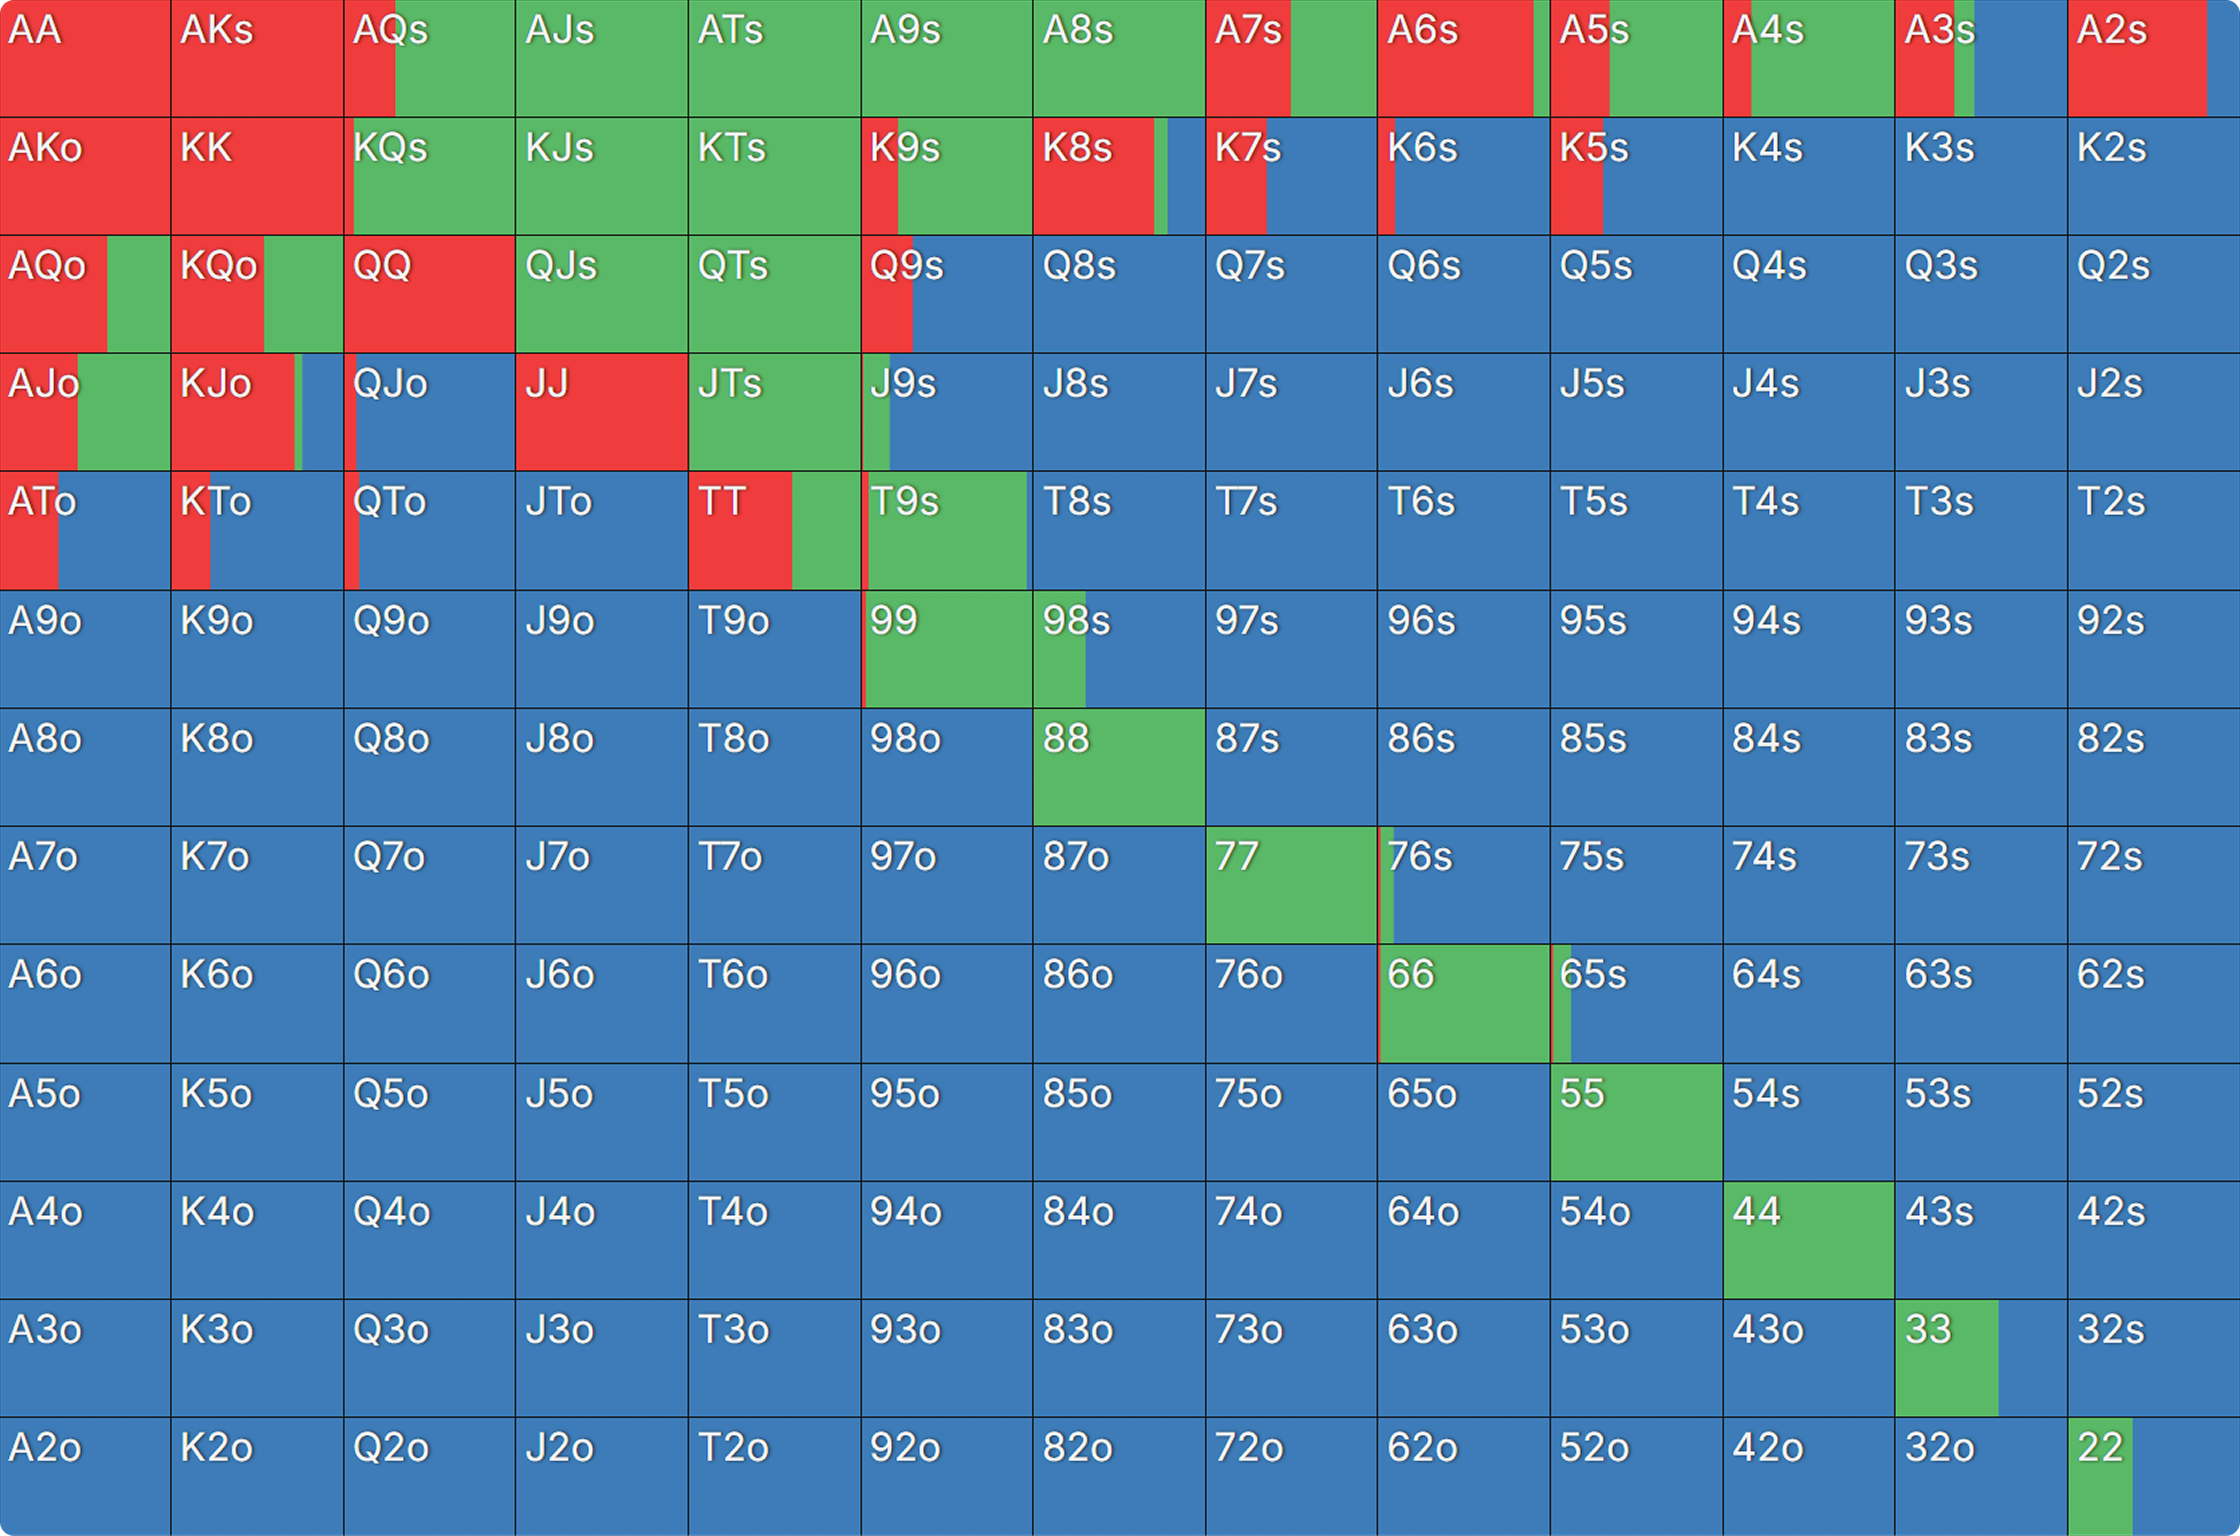
BTN Responses vs UTG+1 Open
{{grid: 2}}
{{/grid}}
While there are some minor differences in these starting ranges, such as BTN flatting more pocket pairs and T9s in the PKO example, these ranges should be close enough to produce comparable flop reports.
Note: If you do wish to compare identical ranges you can modify the ranges in the “Hand Details” section of the AI solution setup prior to producing your output. Keep in mind this may impact the accuracy of your report output as modifying your preflop inputs will change the postflop strategy, which may produce incorrect heuristics.
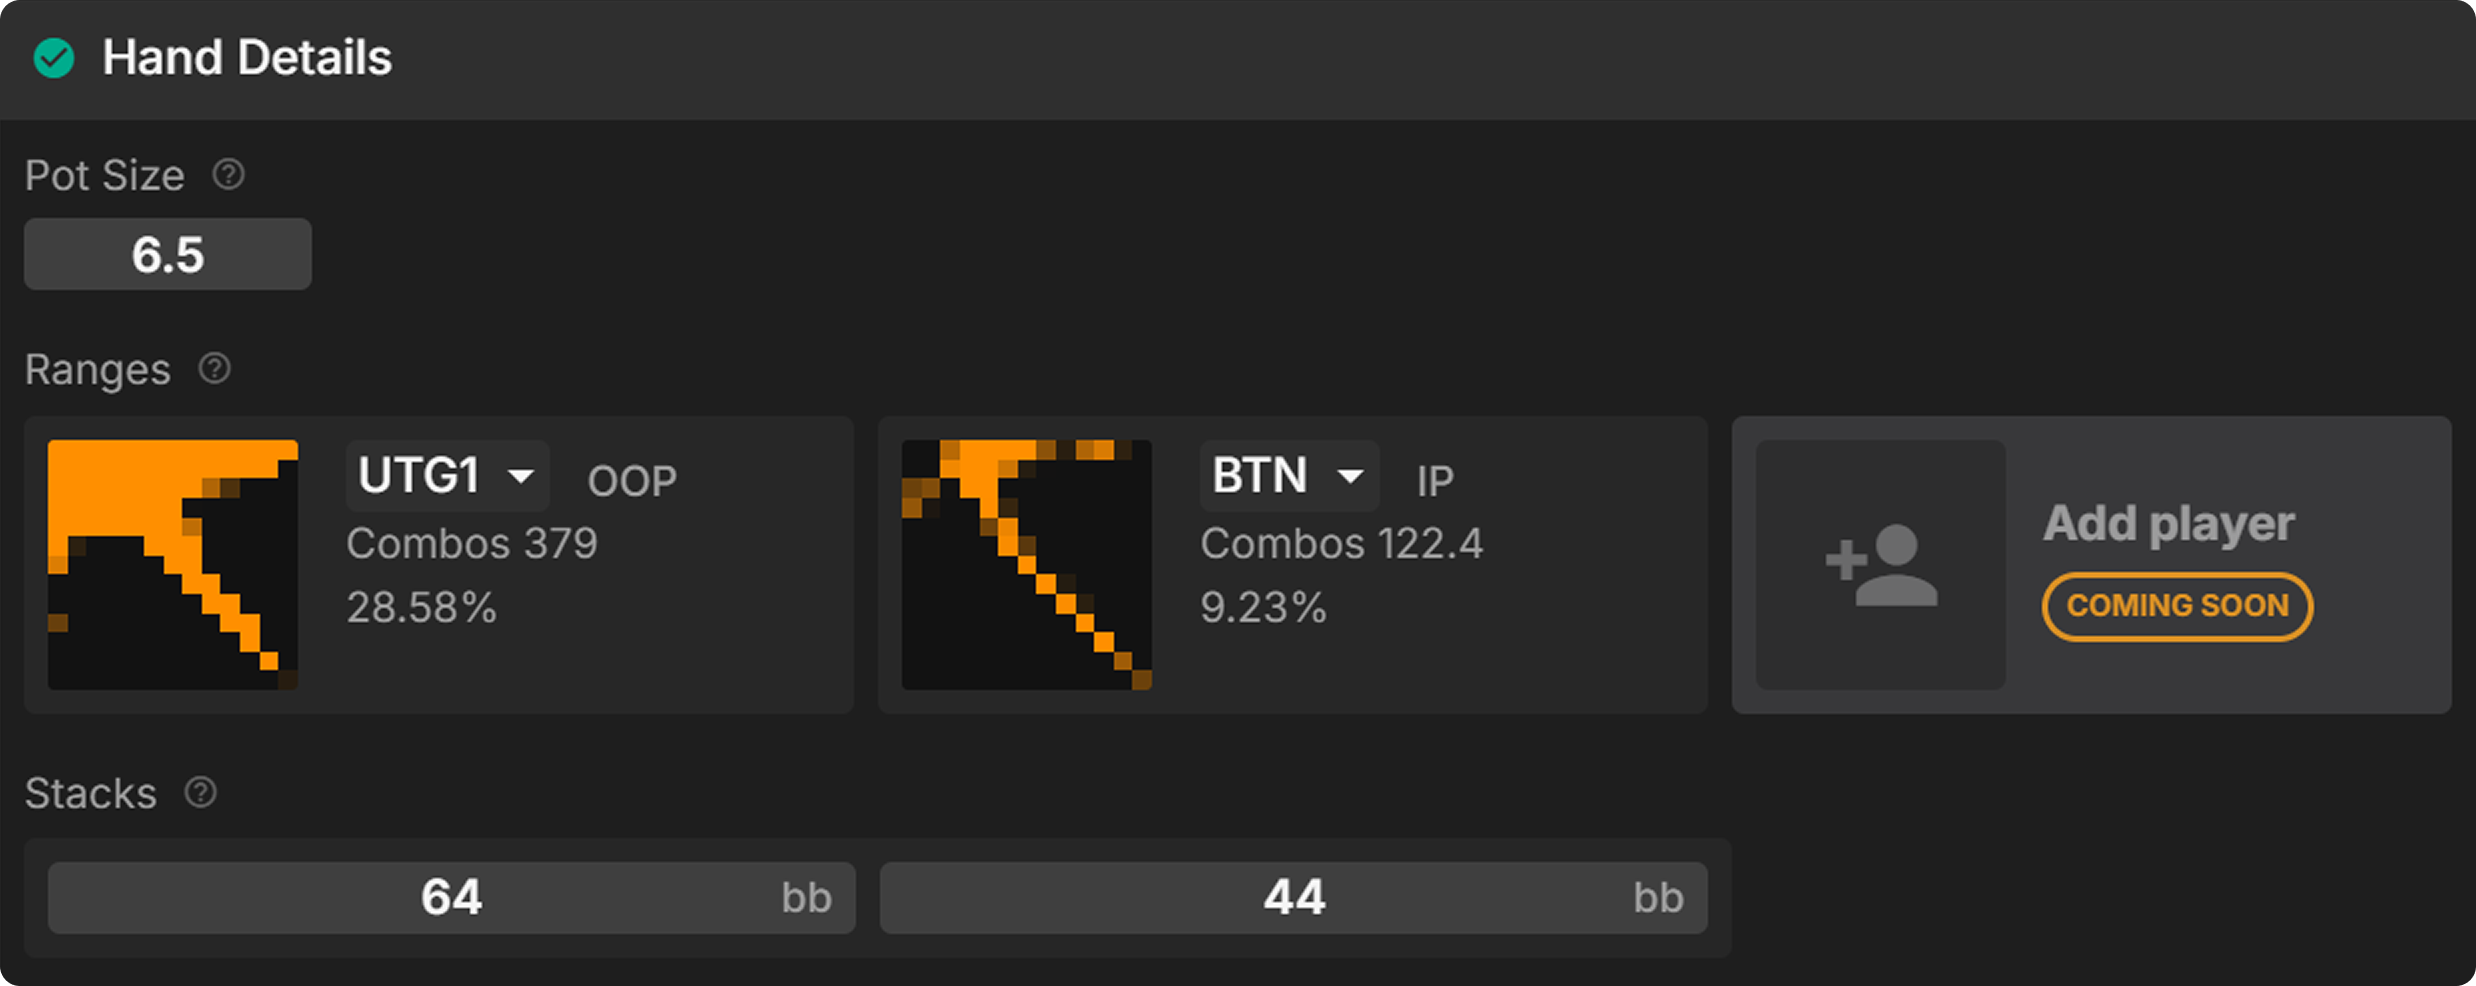
Now that we have configured an AI solution setup for both scenarios, we can produce custom reports that will aggregate the solution for each possible flop to test our three hypotheses.
Report Output and Observations
Now that we have covered the preflop solutions we will be using as input for these reports and our parameters for the AI solution, we can generate the output. As this article is not intended to cover specific steps for creating custom aggregated reports, we will skip ahead to the hypotheses produced based on the report itself. For guidance on generating reports from custom solutions, please read through these release notes. For general support on navigating aggregated reports, see this help center article.
First Hypothesis
We can see some interesting trends straight away when comparing our results. Specifically, when we look at UTG+1’s betting frequencies in each report.
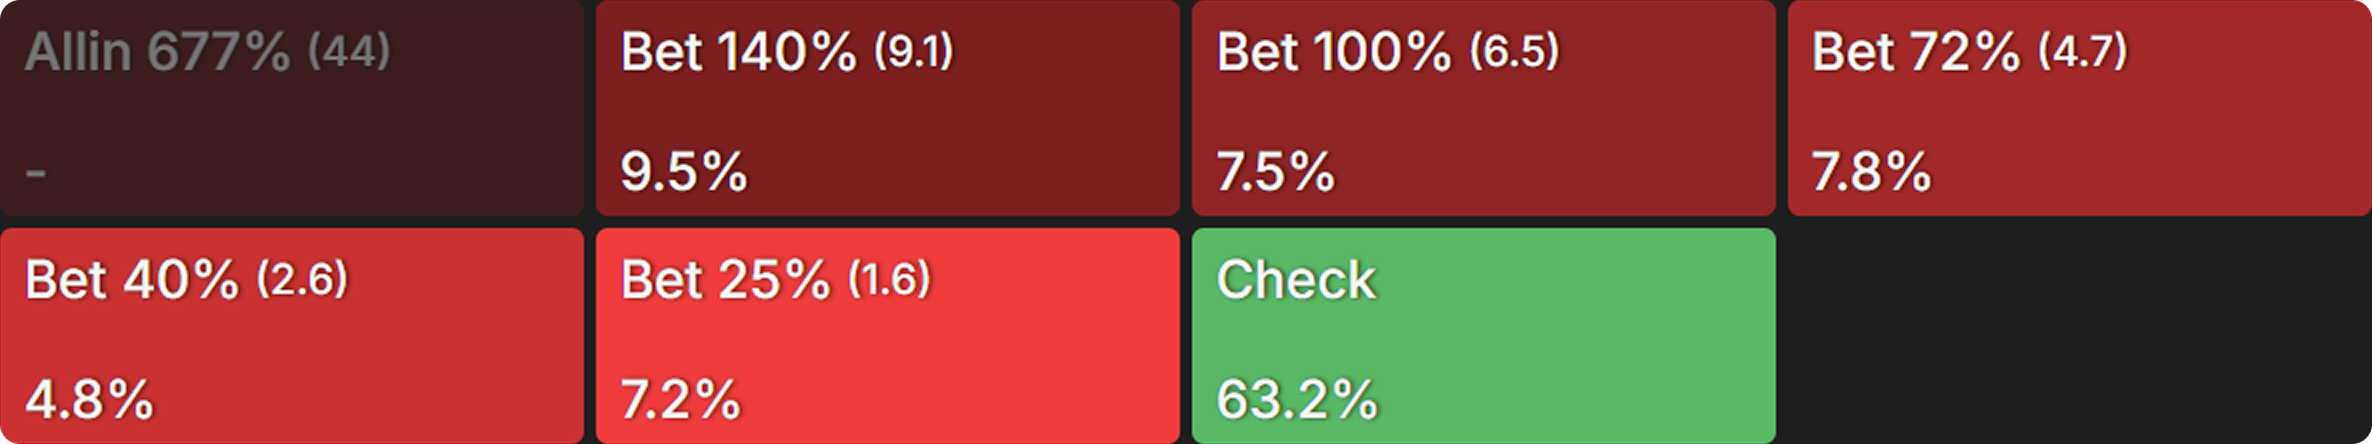
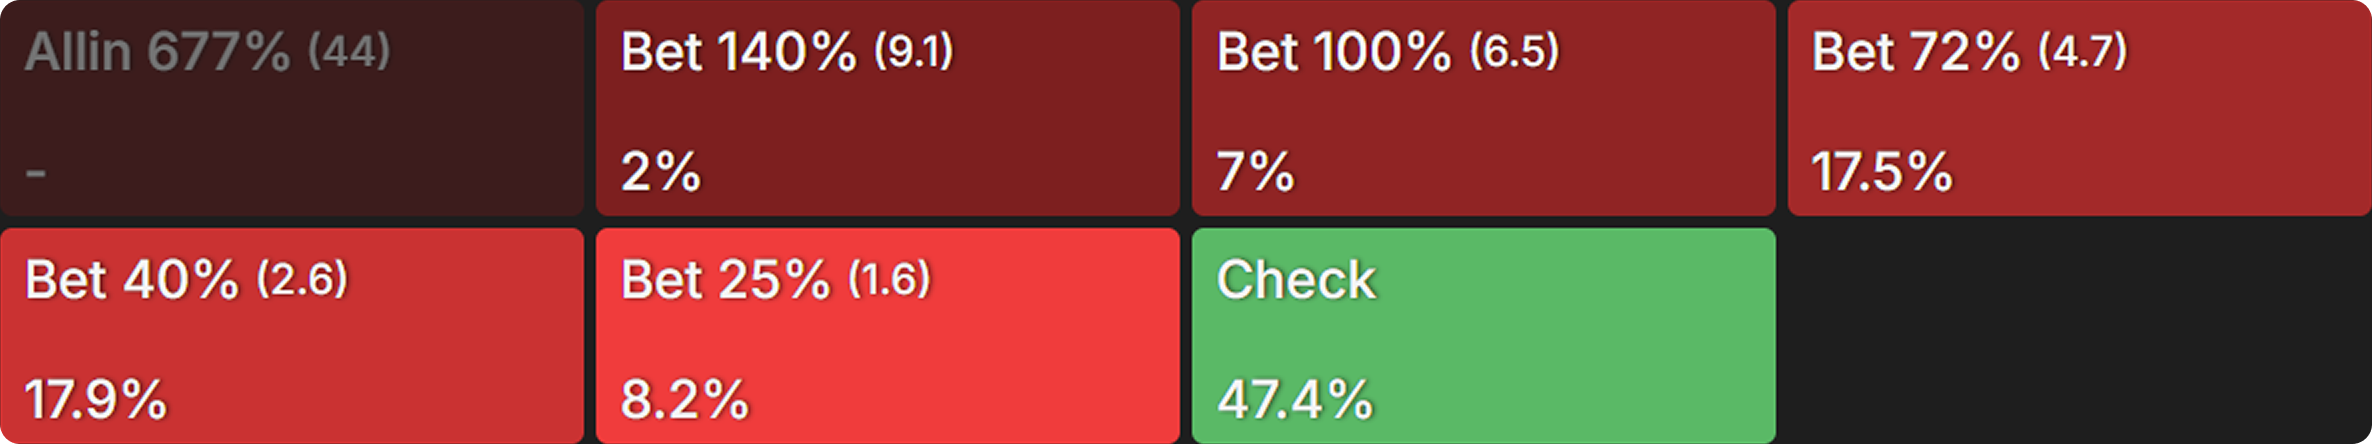
While we do see more betting overall, it’s the 40% and 72% pot bet sizings that are used substantially more often in a PKO relative to a Classic MTT, where UTG+1 is c-betting pot or more nearly twice as often (9% versus 17%). This seems to contradict our expectations, so let’s look at the data to see where this difference occurs:
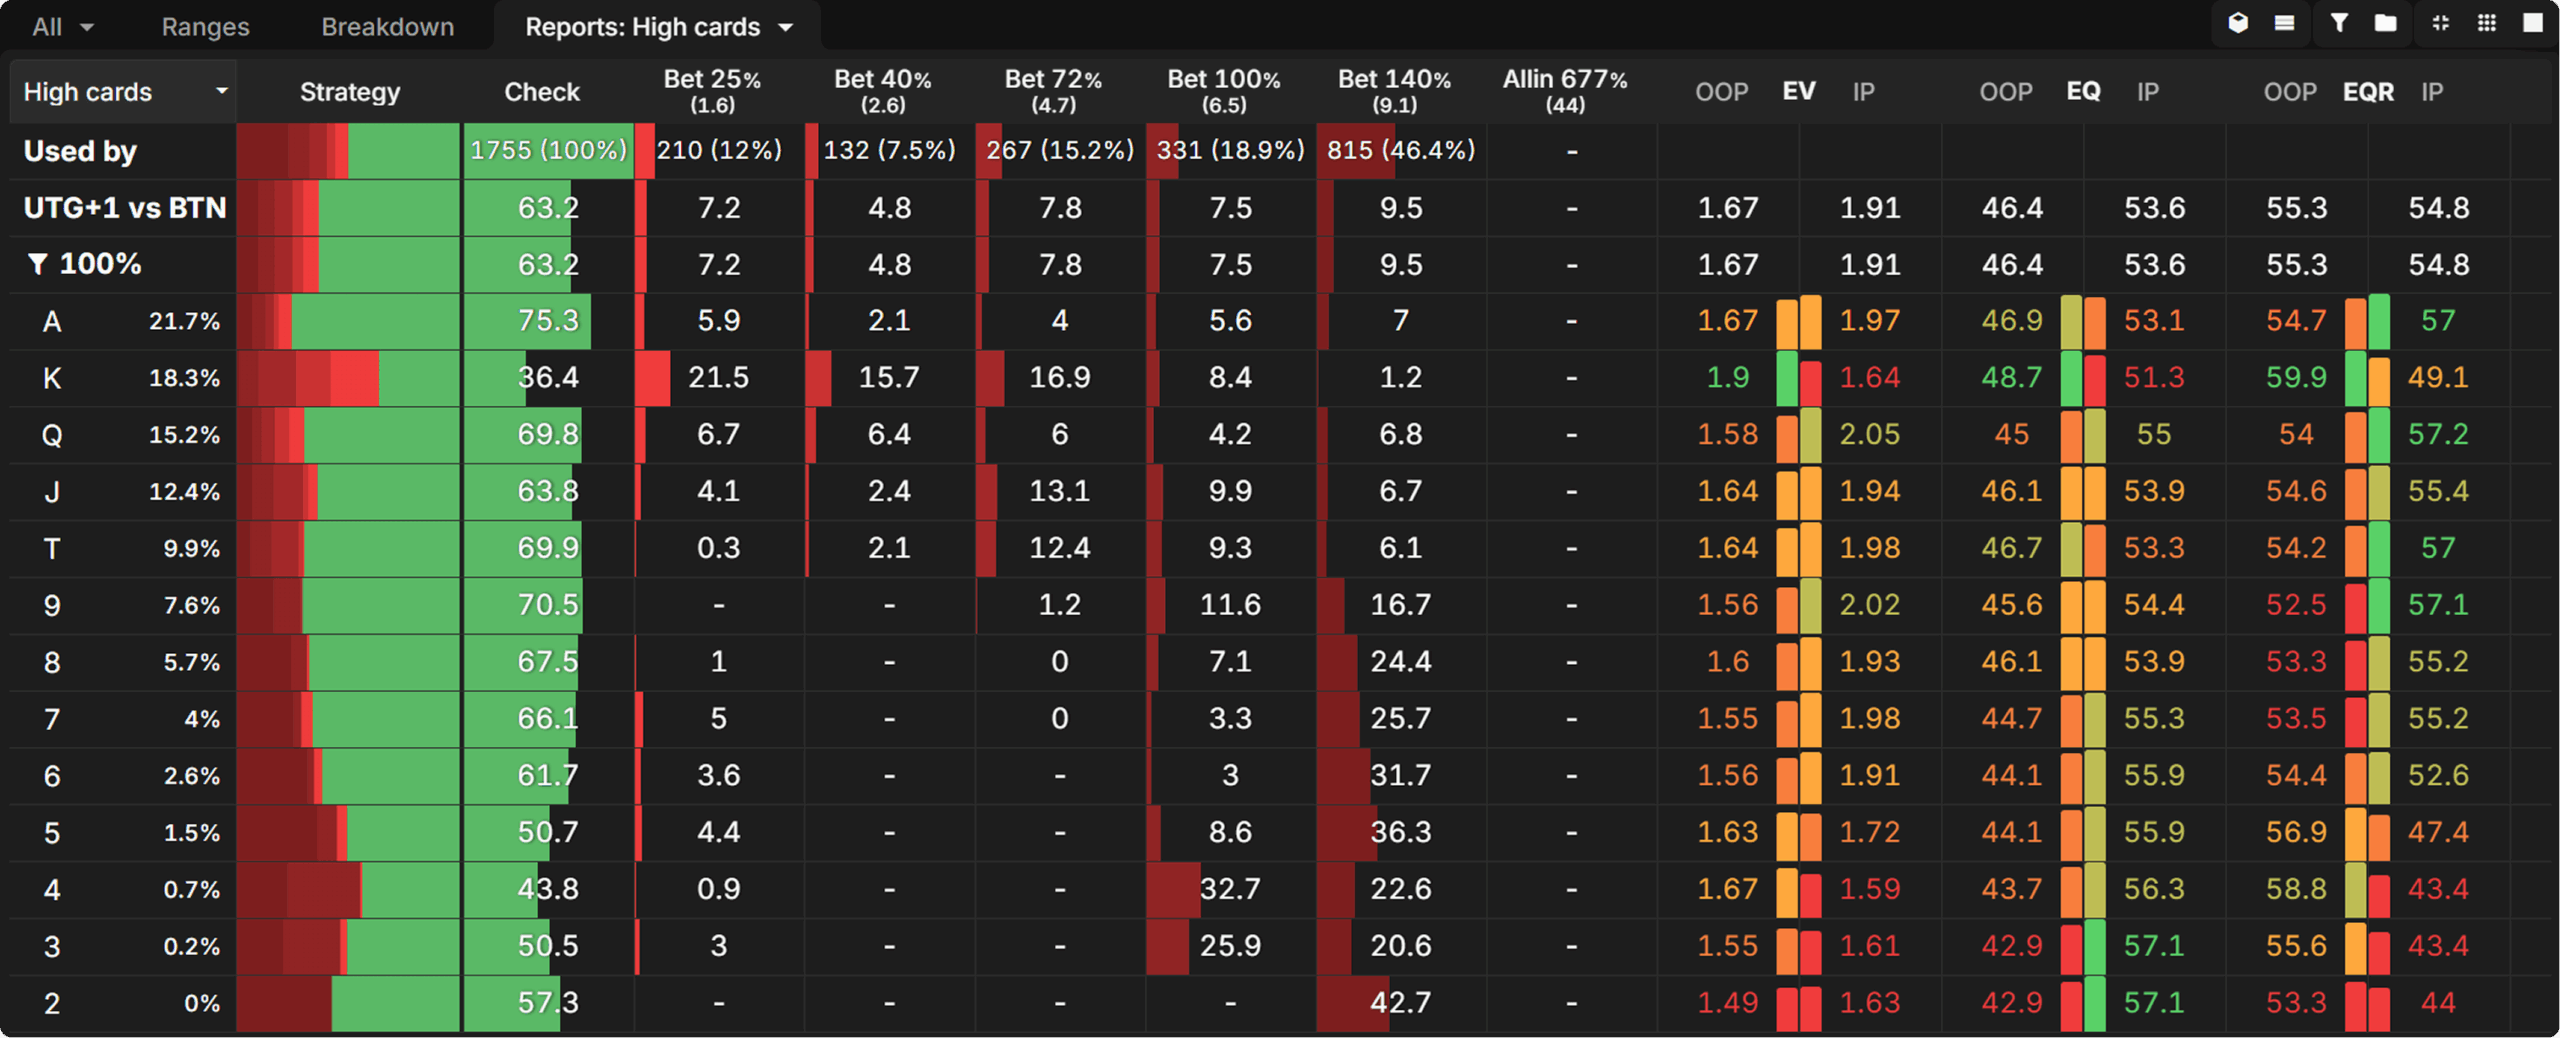
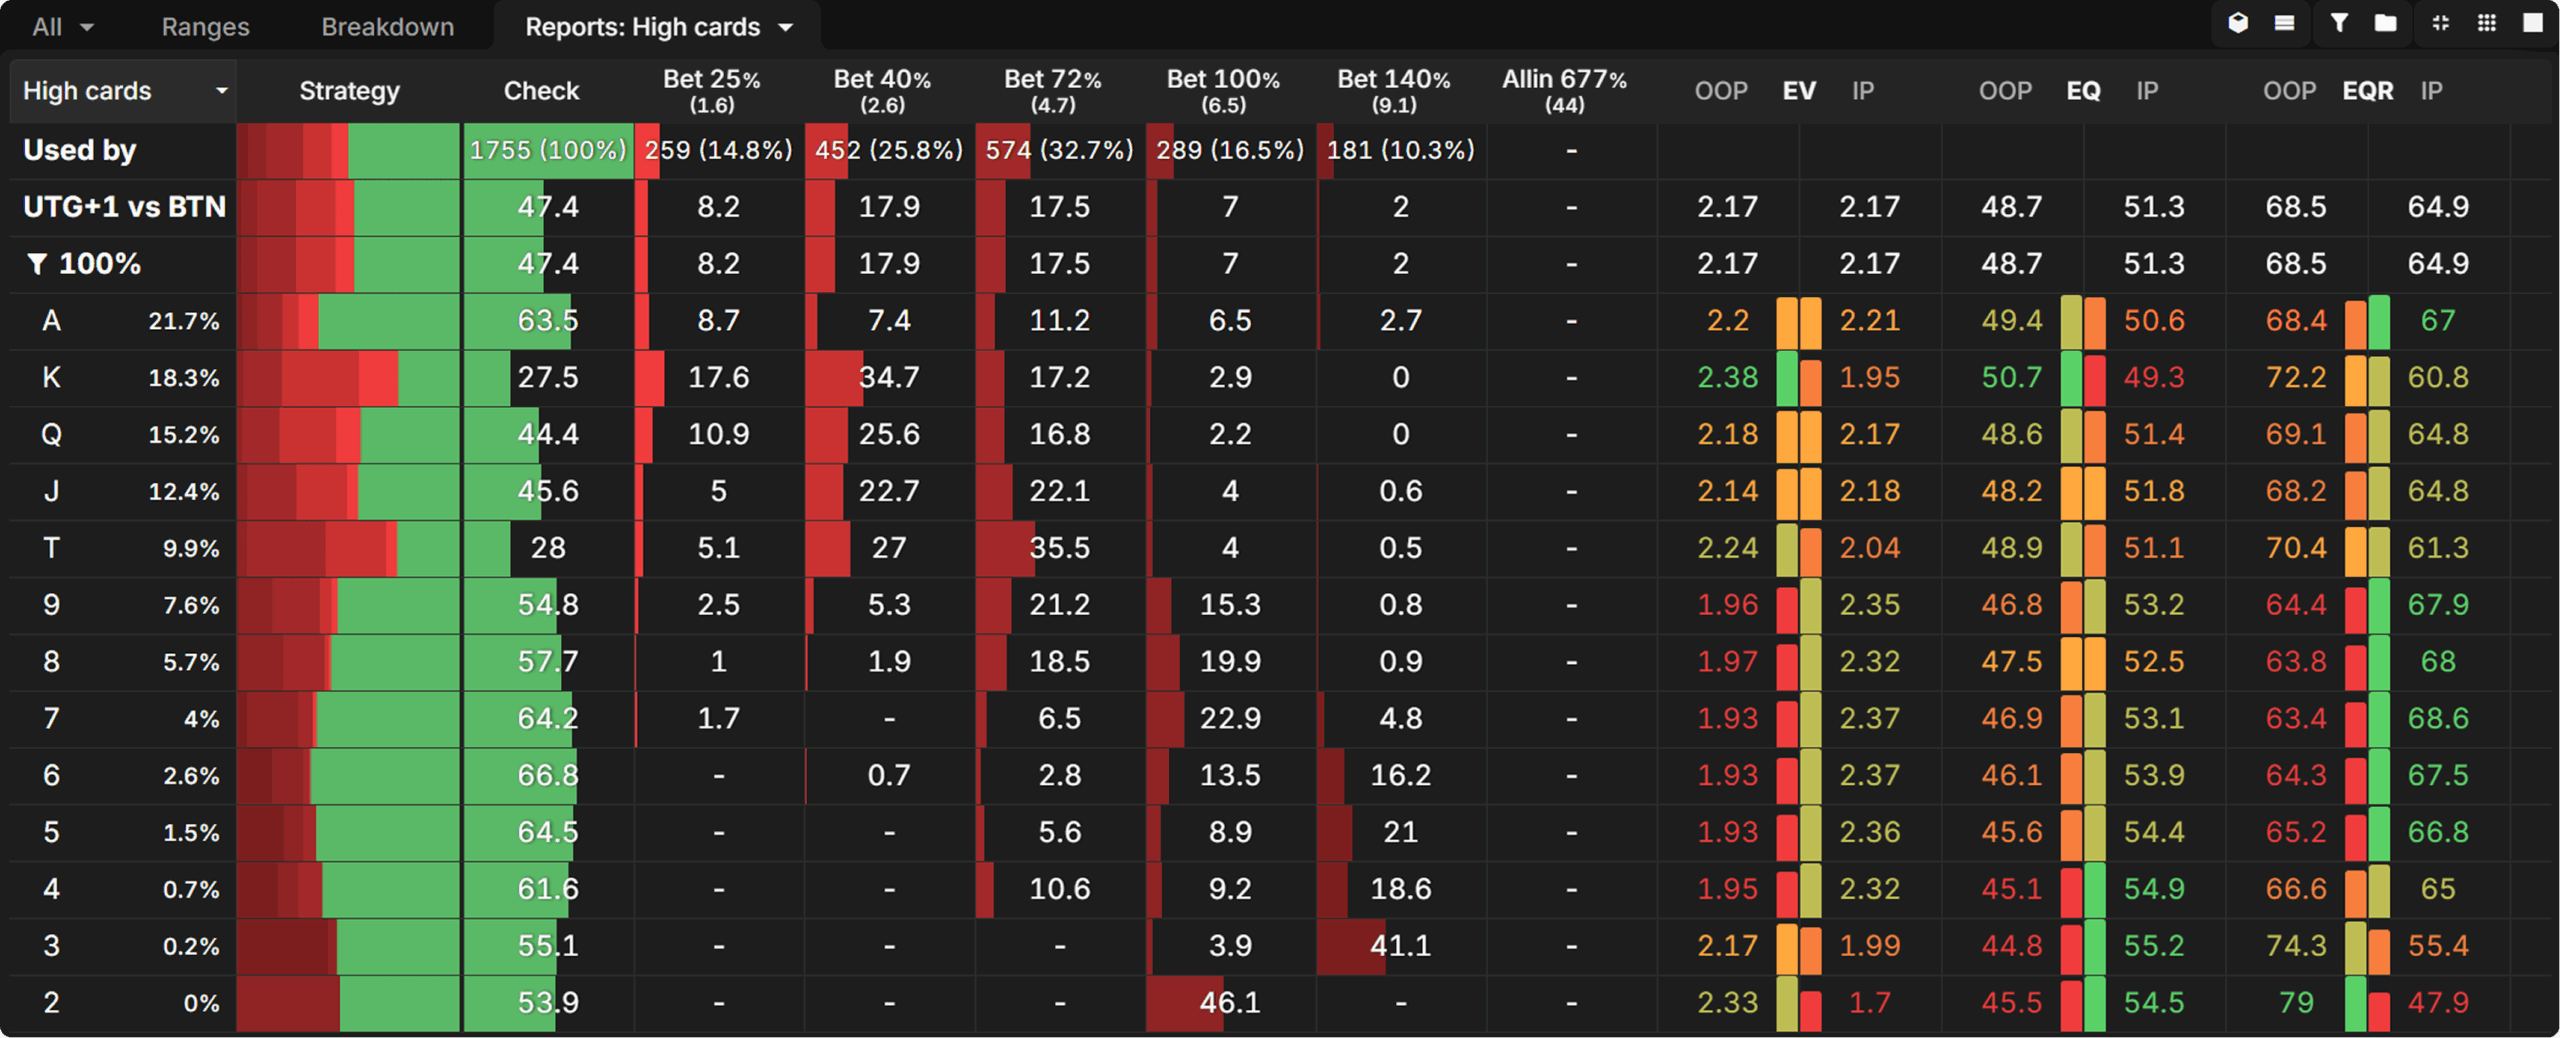
One of the most significant differences between these two reports is the EV disadvantages UTG+1 has in a PKO environment versus a Classic one. We can see that overall EV runs much closer in the PKO report, where there is no difference compared to the 0.24bb EV advantage the Button has in the Classic report. We can also notice fewer large bets overall, but many more middle-sized bets on 9 to King-high boards.
One of the most important takeaways from this hypothesis is that relatively small differences in preflop ranges can have an outsized impact on EV advantages postflop. Understanding how preflop ranges change in PKO games relative to Classic ones will help you adjust your c-bet sizes postflop.
Outcome
Second Hypothesis
To test this, we’ll give UTG+1 a 40% pot bet size in both solutions and observe how BTN responds in each report.
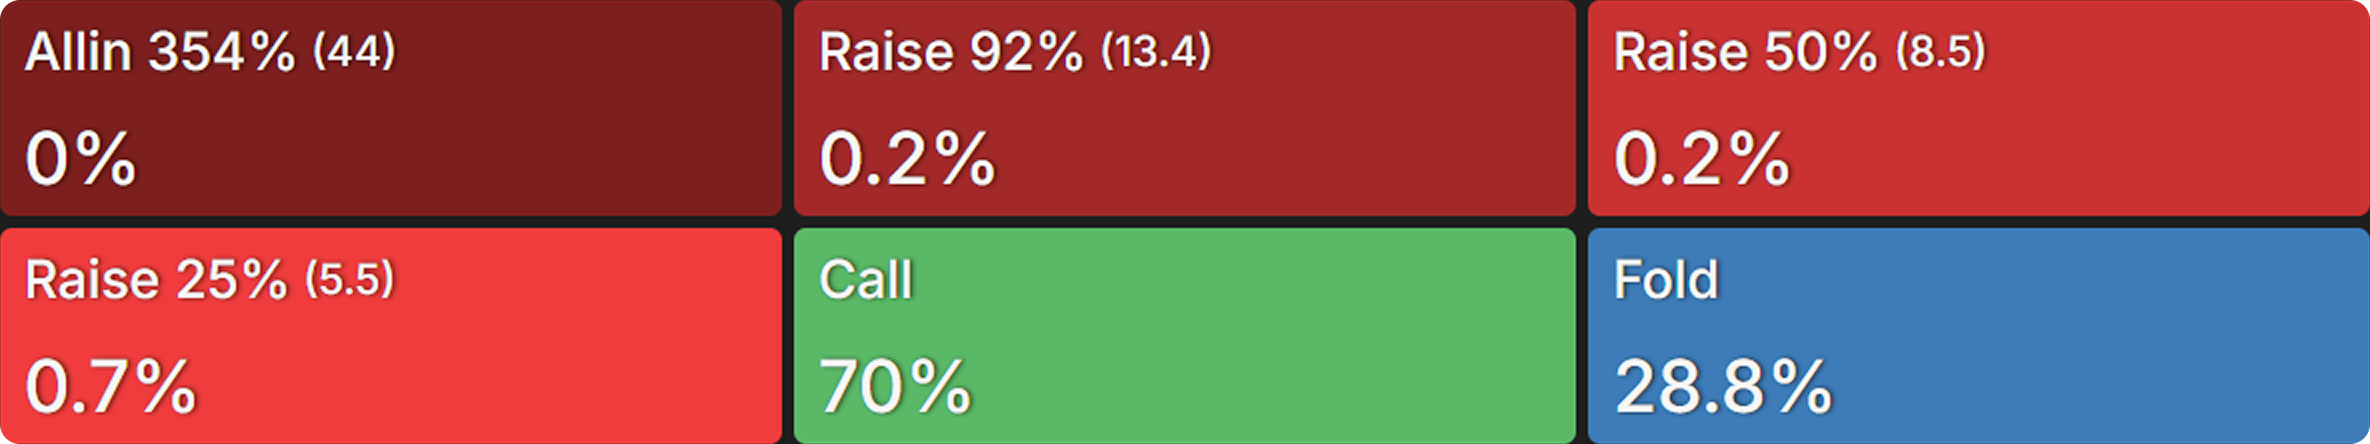
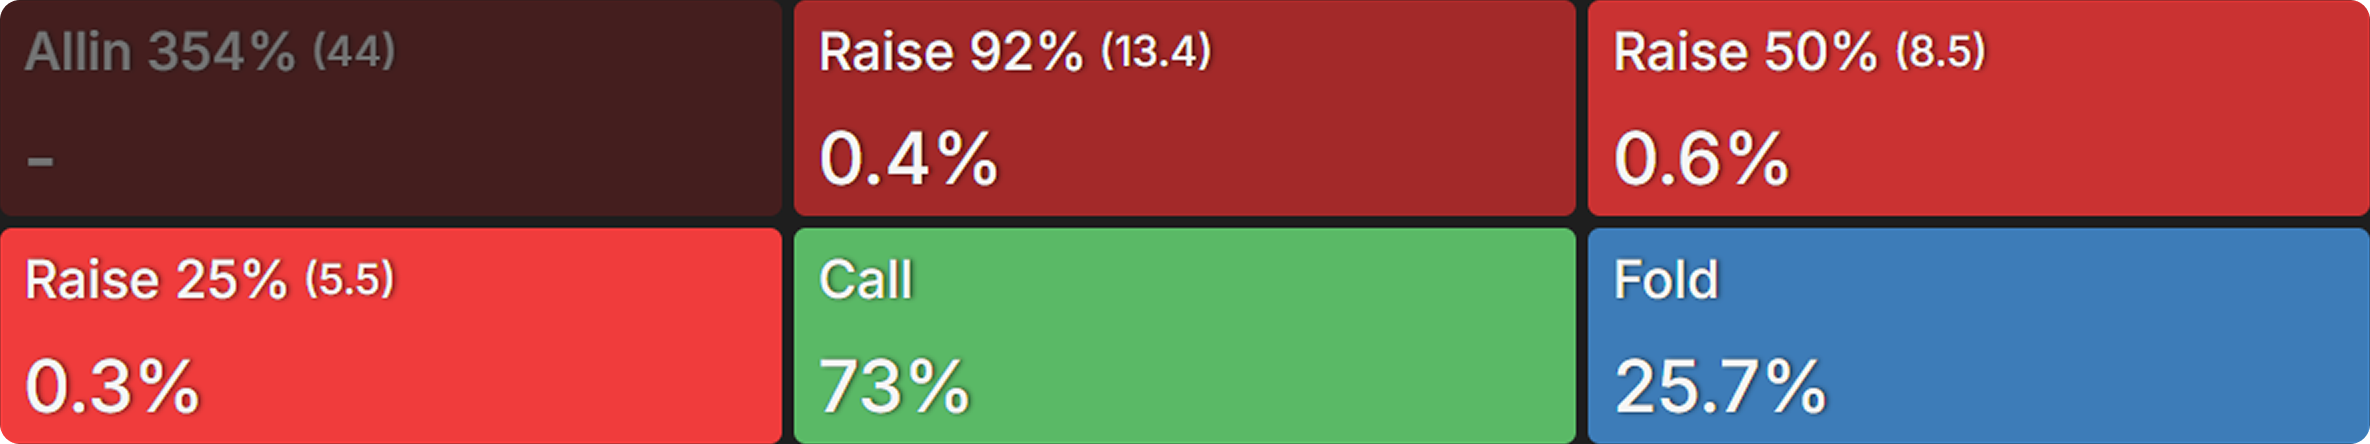
Here we can see frequencies running very close to one another across reports, with the BTN in a PKO calling 3% more often, while only raising 0.2% more often.
Outcome
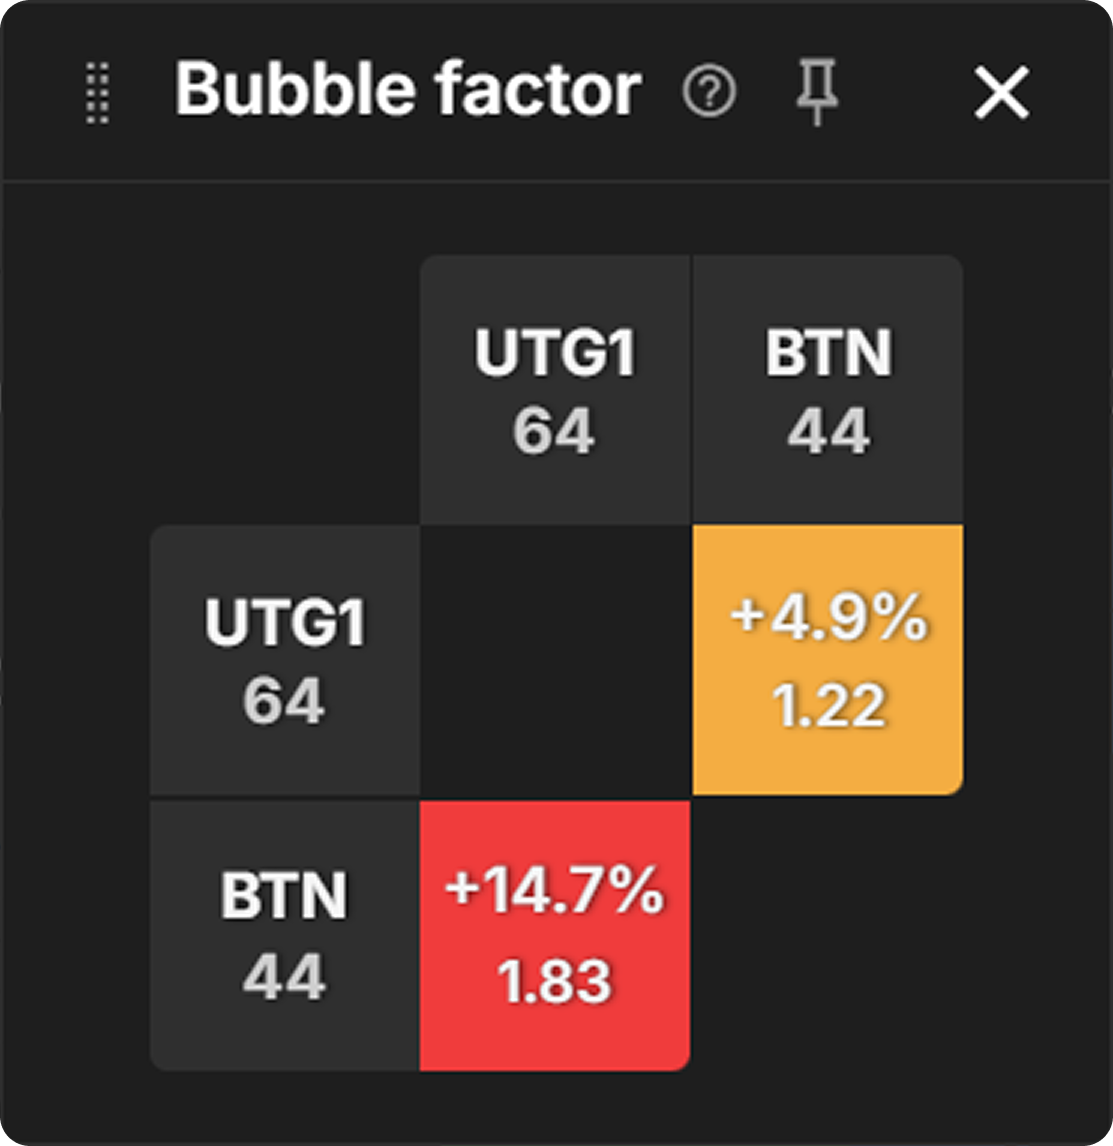
Third Hypothesis
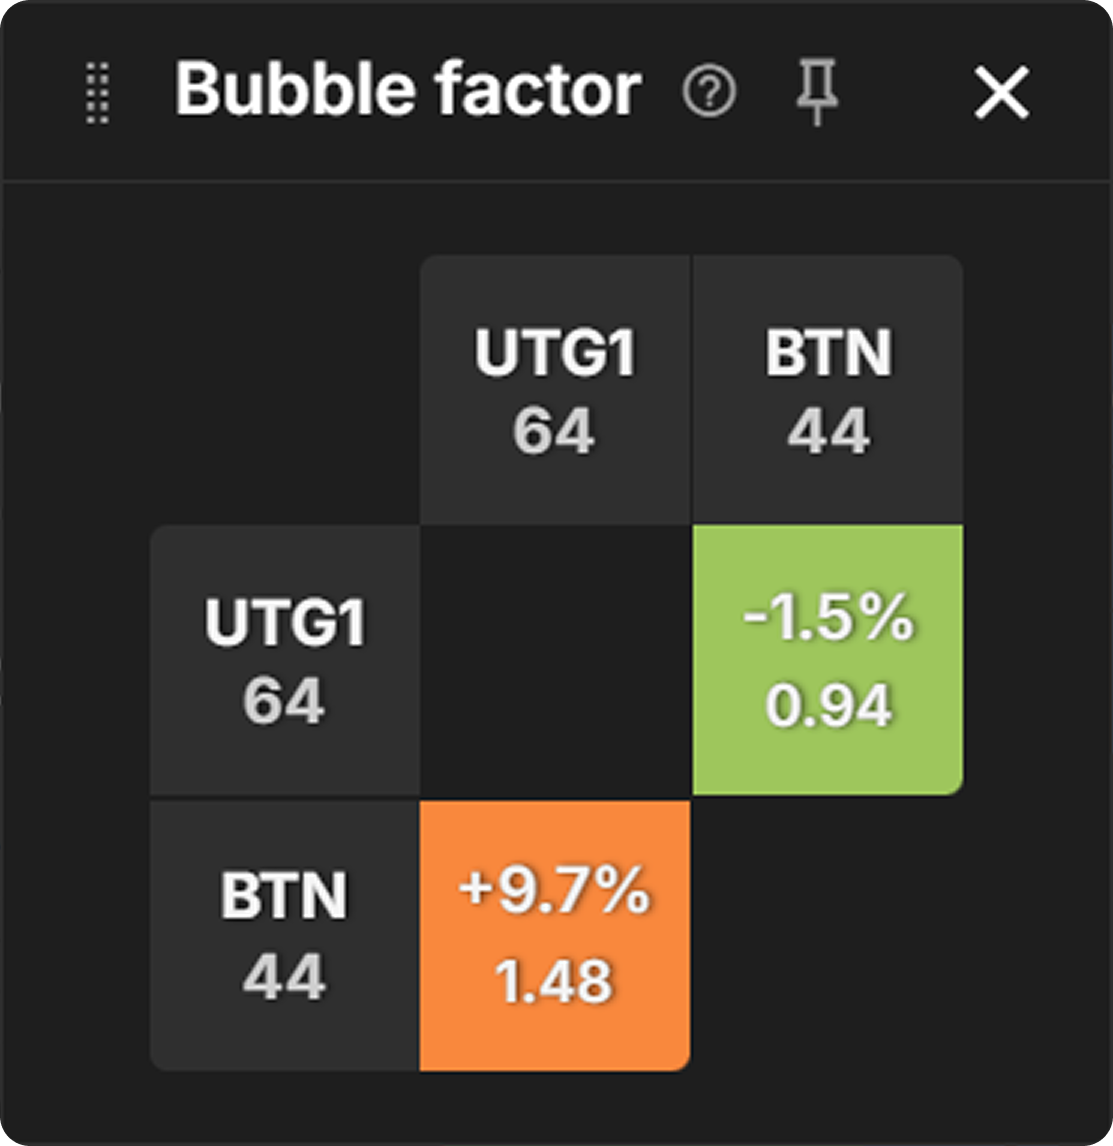
First, we’ll compare overall RPs in both solutions to see if our premise is correct.
Risk Premiums and Bubble Factors
{{grid: 2}}
{{/grid}}
We can see that our third hypothesis is correct as the RPs are significantly lower for both players in the PKO solution. Overall, the gap between risk premiums is 1.4% bigger in the PKO solution compared to the ICM one. Though for the purposes of our hypothesis, we’ll focus on the fact that the BTN’s risk premium is 5% lower in the PKO solution.
As a next step, we can set up a scenario where the BTN has to call an all-in bet from UTG+1 and compare calling frequencies between the two solutions:

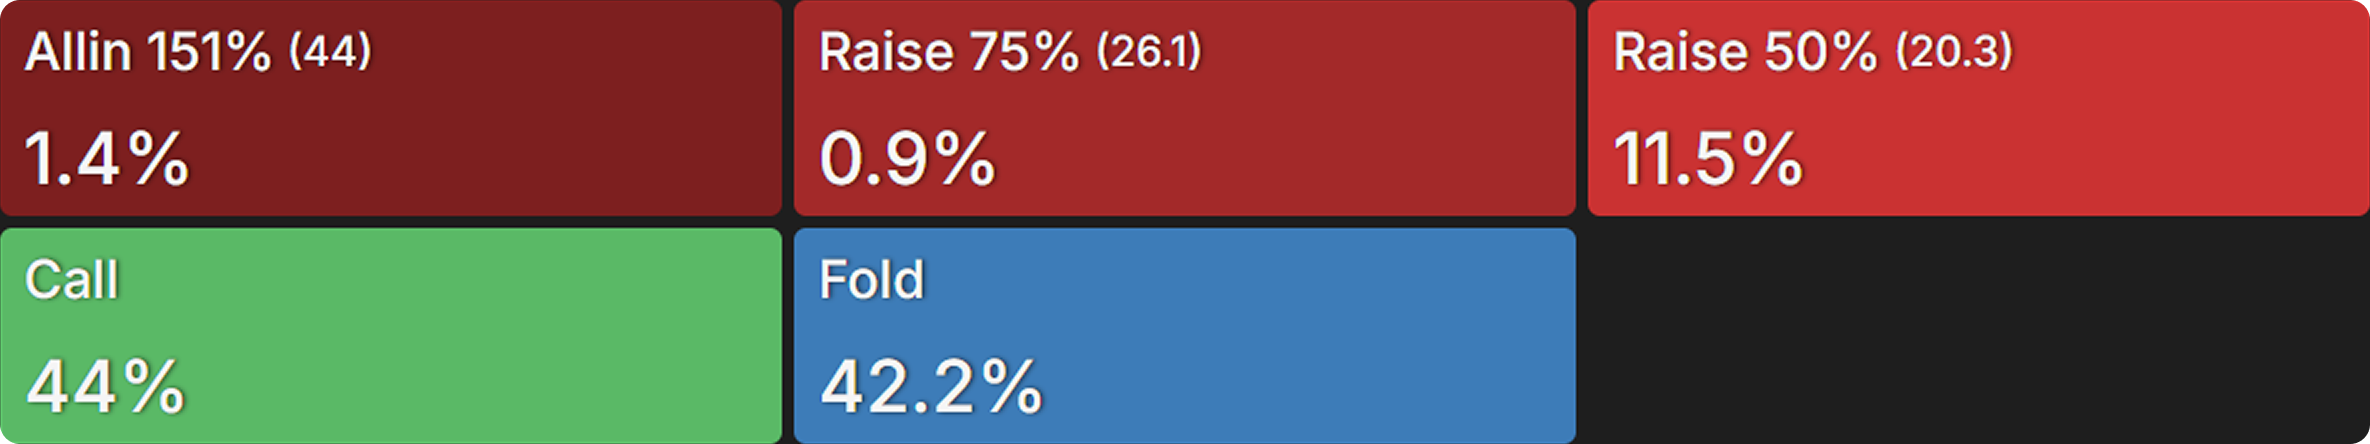
Before looking at BTN’s calling frequencies, it’s important to note that UTG+1 is using an all-in 3-bet nearly half as frequently in the Classic solution as their RP is significantly higher.


We can see that despite UTG+1 shoving a wider range in the PKO example, the BTN is still calling 5% wider. We can attribute this increased calling frequency to the BTN’s 5.4% lower RP in the PKO solution versus the Classic one.
Outcome
Custom Aggregated Reports Applications
As we’ve seen, Custom Aggregated Reports are a powerful tool for testing broad game heuristics. Here are some examples of questions you can answer through Custom Aggregated Report outputs:
Q: How does increasing a player’s bounty size impact postflop strategy?
A: Produce Custom Aggregated Reports for two identical preflop spots, editing the bounty value in one of the reports in the “Hand Details” section in the Setup tab.
Q: How does payout structure impact postflop strategy?
A: Produce two AI solutions for the same preflop spot, but for each one select a different tournament with different field sizes from the “Payout Structure” section in the Setup tab. For instance, you can run one CAR for a flop spot using the Pokerstars $109 Daily Cooldown (278 players) and a separate Custom Aggregated Report for the same spot in the $11 Sunday Storm (9544 players) to see just how much our flop strategy changes in big versus small field tournaments.
Q: How does stack depth impact a covered player’s c-bet sizing near the bubble?
A: Produce Custom Aggregated Reports for two identical SRP spots for one of the ICM near bubble solutions where the shorter stack is the opener. When setting up the AI postflop solution, reduce the stack size of the covered player in the “Hand Details” section of the Setup tab.
Summary
In this article, we went through the process of using the Custom Aggregated Reports to test our assumptions about how ICM spots are played in PKO MTTs. Based on our initial hypotheses, we can now state the following:
Hypothesis
Outcome
Correction
The covering player uses larger flop bet sizes in a PKO to increase the likelihood of playing all-in by the river.
❌ False
This proved to be false as the balance in EV between UTG+1 and BTN across flop textures had a close relationship to bet sizings and frequencies.
The covered player raises flop less often with low-equity hands in a PKO because the covering player folds fewer hands.
❌ False
This proved to be false again, but as a whole, we see the covered player (BTN) raises flop more often in the PKO solution versus Classic.
The covered player will call flop all-ins wider in a PKO due to their RP being lower.
✅ True
This proved to be true, despite UTG+1 using an all-in 3-bet sizing less frequently in the Classic ICM solution. This proves that overall in PKO MTTs, we are willing to put our tournament life at risk more often compared to in a Classic MTT, even as a covered player. What assumptions would you like to see tested through Custom Aggregated Reports using the method shown here? Let us know in the comments!
The Theory of Bounty Tournaments – Part 2: ICM and Equity Drops
In part 1 of “Introduction to Bounty Theory,” we analyzed how the structures of bounty tournament prize pools form the basis for several potentially significant insights into the fundamental differences between bounty and non-bounty MTTs. In particular, we noted that the two prize pools—the bounty p
The Theory of Bounty Tournaments – Part 1: Prize Pool Fundamentals
Bounties are a significant new variable to take into account when studying tournament theory and ICM. This article explores the theoretical fundamentals of bounties, starting with an analysis of the structure and function of the two sub prize pools—the regular prize pool and the bounty prize pool—th

Bringing It All Together: PKO Review
Throughout the past year, our writers have presented nine unique articles and videos outlining how and when to adjust from a Classic MTT to the Progressive Knockout (PKO) tournament format. Given the sheer amount of information in these articles, how much do you recall? In this article, we will revi