How to Exploit Capped Ranges with Custom Aggregated Reports

Overview
The custom aggregated reports are my new favorite feature. I already loved the (presolved) flop reports tool, but these custom ones let you zoom out and view the general approach to optimal strategy when facing imperfect players and ranges. ɑ
Today, I wanted to look at the global strategic changes postflop we should make when our opponent has capped their preflop range in tournaments. This is something I often see in the games I play. Quite simply, the ranges are too tight and do not include board coverage, especially 3-betting ranges.
There are player populations where, when 3-betting, they always have a very strong hand, and very little in the way of bluffs. How should we play against these players?
As is always the case in my articles, a reminder that I am not a professional player, I am a writer who knows his way around solvers and is using them to fix his leaks. Not only do the players in my games have the leak we are going to explore, but I am guilty of it myself from time to time.
Ranges Without Board Coverage
Before looking at 3-betting ranges, let’s first tackle the question of how to proceed against players whose ranges are not well-rounded enough to cover all possible boards sufficiently. This is something I explored in my article on board coverage; however, I cherry-picked the hands at the time. Now I can look at what happens on every single strategically distinct flop.
In short, board coverage refers to ensuring that a range includes all potentially strong hands on any given flop. For example, below are the GTO ranges for a single-raised pot between UTG and BB with 100bb stacks:
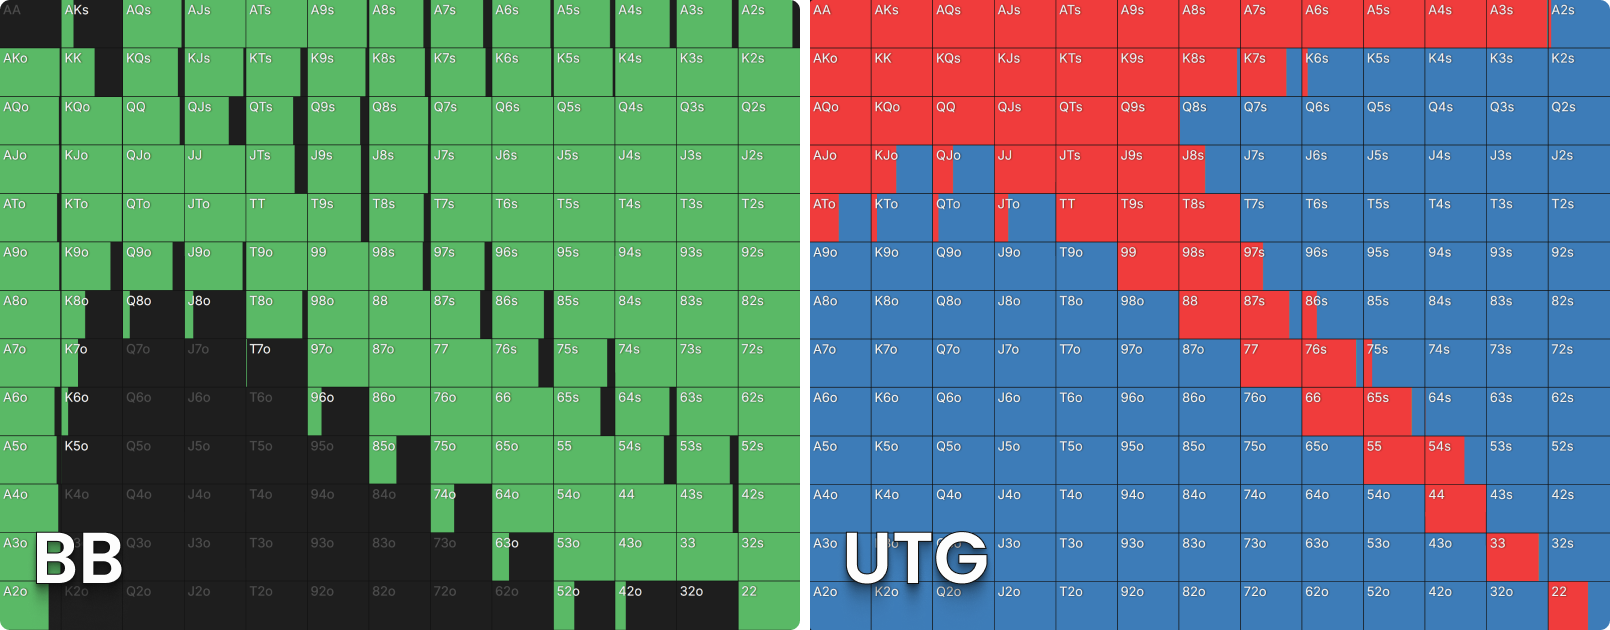
UTG has a tight range, but it includes a lot of suited Ace-x and King-x. The Ace-x goes down to A3s. While the old-school wisdom would argue that these are ‘dominated’ hands, what they offer is a very economical way to hit a lot of different flops. We always potentially have flush draws and flushes, we can make low straights, and we have the potential to make trips on low-paired boards.
Let’s compare this to a range where that is less the case. We kept the BB range the same, but the UTG range is now much more high-card-heavy, while still representing a similar percentage of overall hands. They do have all the pocket pairs in this range, so they are more likely to make sets, but if a low-paired board came, the only time their hand could contain that low card is when they made quads.
For the same reason, low straights are very hard to make for them. When it comes to flushes, suited cards are now a smaller proportion of their range, thereby also lowering the likelihood of making flushes. What we have done is ‘capped’ the UTG range, making certain nutted hands much less likely.
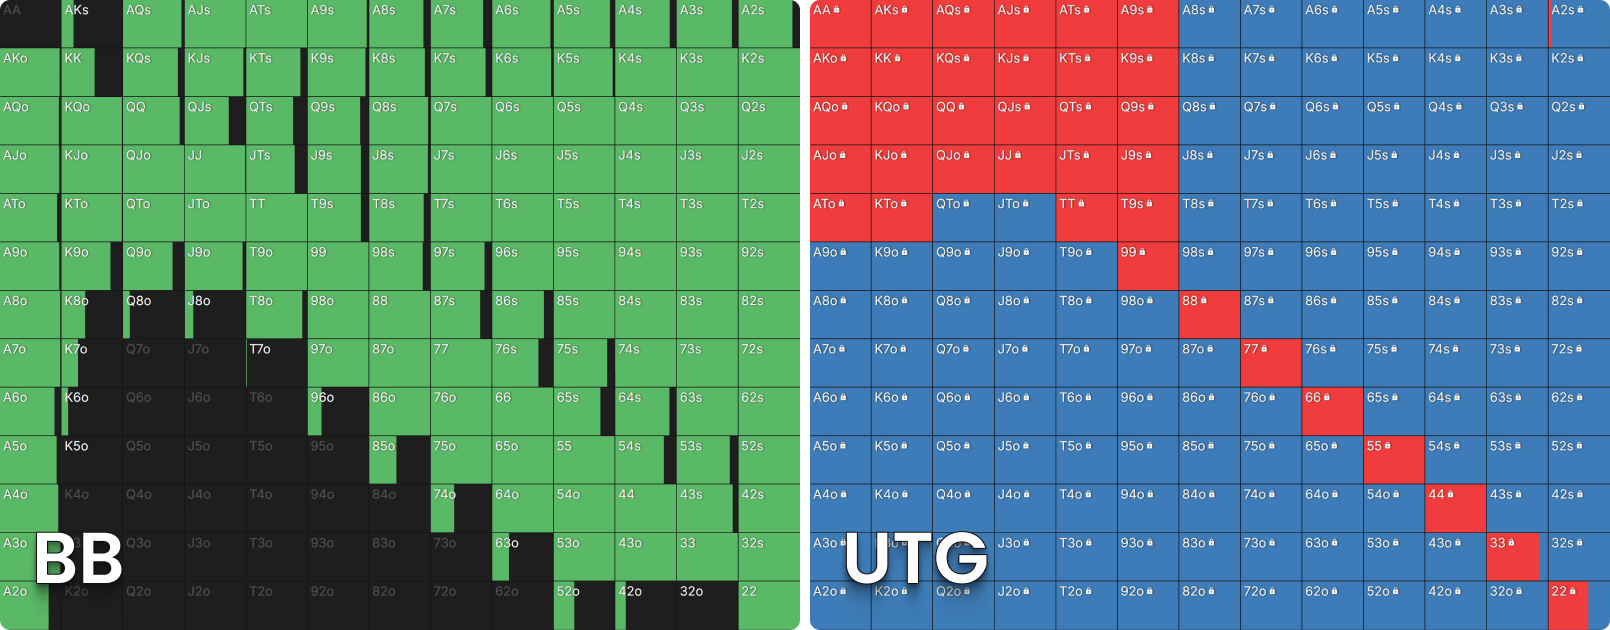
In my board coverage article, I picked low flops that these players would obviously struggle with. This time, I have run two custom aggregated reports—one with the GTO ranges and the other with the capped UTG range—to see what the global adjustments are.
Note: The BB can gain EV against this new UTG range by deviating from their GTO strategy; their calling range would likely get tighter because UTG is more weighted towards pairs and strong Ace-x. However, we maintained the BB’s strategy because we’re interested in the effects of a capped range on postflop strategy. If we compared the reports, one in which both ranges were modified, we wouldn’t know to what extent the capped preflop range caused the change in strategy.
Comparing Performance Metrics
Before analyzing the strategic changes, the first data points I like to look at in these reports are the three major performance metrics: expected value (EV), equity (EQ), and equity realization (EQR). They give an overall impression of who is performing better across the 1755 flops.
These are from the root node; the metrics change in response to each action taken by a player. However, I think that the first node, before any postflop actions have been taken, is the most telling of the cost of capping your range.
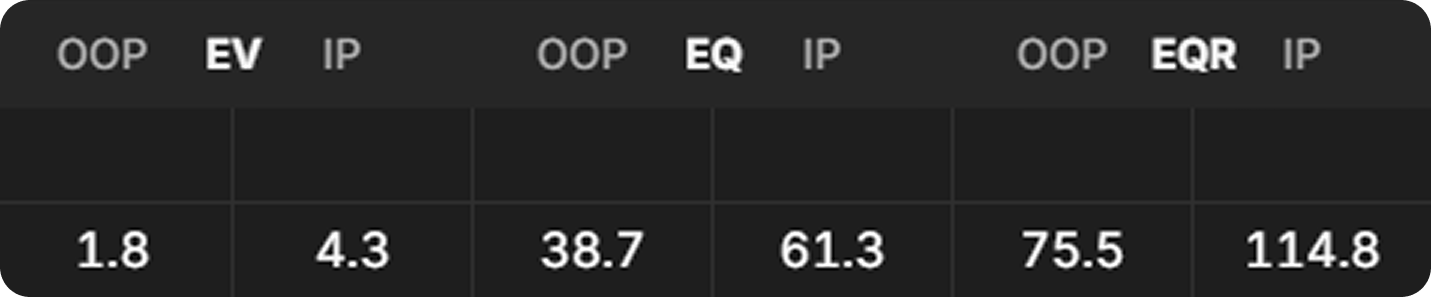
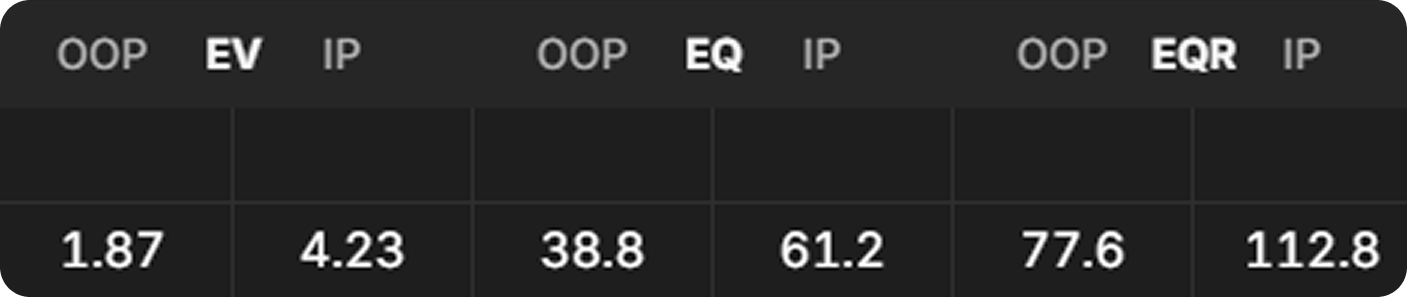
The equities differ slightly because the ranges are different. The equity realization also differs; we will cover that later in this article.
The difference in EV is most interesting for now; 0.07bb might not sound much, but as I often like to frame it, that would be a 70 bb/100 error over a large sample. A cash game player would wince when they see that.
So, without even peeking at the strategic changes, we can see that capping our range in a way that reduces board coverage is costly. Now let’s look at how it might cost us.
BB’s First Action


Going from ~99% checking overall to ~96% is a small difference in the big picture. However, in relative terms, that means there’s four times more leading than at equilibrium. Also, notice the BB’s preference is now going toward the smaller lead size.
This should make sense; the boards with more leads will be low and connected (e.g., 654r). The increase in leading is an example of attacking a capped range. If UTG were smart, they would recognize they can’t raise very often in these spots and should also check back on these boards a lot. So the BB leads to exploit the capped range and to get thin value.
When the BB Checks


The change in frequency compared to the previous node is pretty similar here; from checking back ~19% of the time to ~21%. The more significant shift in strategy relates to the bet sizes. You’ll notice that the bet sizes get larger as a result. A much more polarized strategy is adopted because, with some hands missing from the range, they find themselves having either a strong hand or a complete miss more often. In addition, the larger bet sizings might also be because their range benefits more from protection. When you have strong hands like overpairs and top pair, but it’s much harder for you to have low straights and flushes, you are incentivized to bet big to price out draws.
Caveat: In reality, the player with the capped range might not understand they have a capped range, and will still c-bet most of the time for a smaller amount. What we are seeing here is the strategy the solver identified as ‘best possible’ for the capped range we forced upon it.
When UTG Bets 67% Pot
The most common c-bet size between the two examples is 67% pot, so let’s look at the response to it.


The BB folds more often in capped world, because UTG has a stronger preflop range. The BB also raises more; 11.5% of the time compared to 10.4% of the time. They favor the smaller raise size, which is more than enough to put pressure on a capped range.
Not taking care of board coverage costs EV. Such ranges can be exploited by being tighter and more aggressive. So fold more, but when you play, consider leading and check-raising more often.
When Villain Has No Bluffs
Now, let’s look at the situation I described at the start of this article, which is players who never have bluffs in their preflop 3-betting range. I really wanted to explore this as I suspect it is one of the most common leaks in poker today.
These are the 60bb ranges for BTN opens, SB 3-bets, and BTN defends for both range matchups. As in the previous analysis, we will keep one of the ranges unchanged so we can be sure the changes in strategy are driven by the range we’re interested in. BTN is constant, SB is variable.
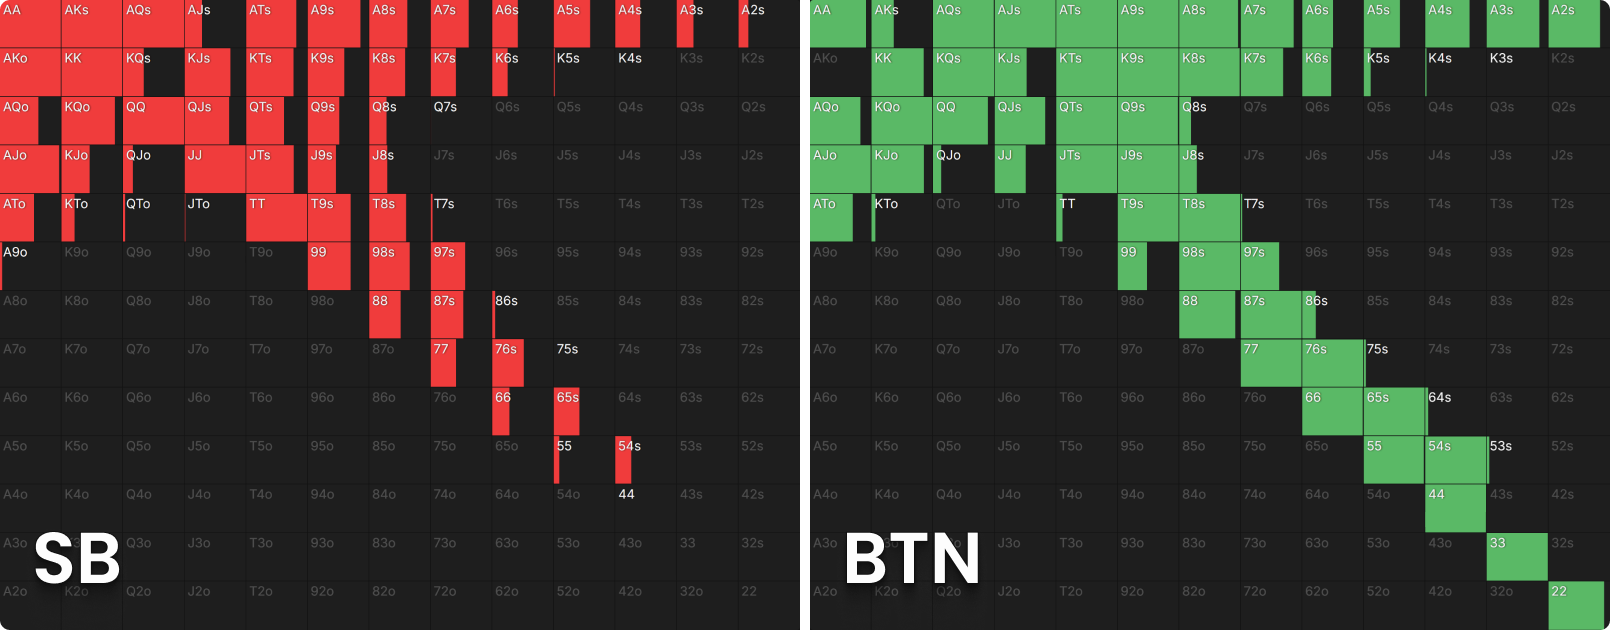
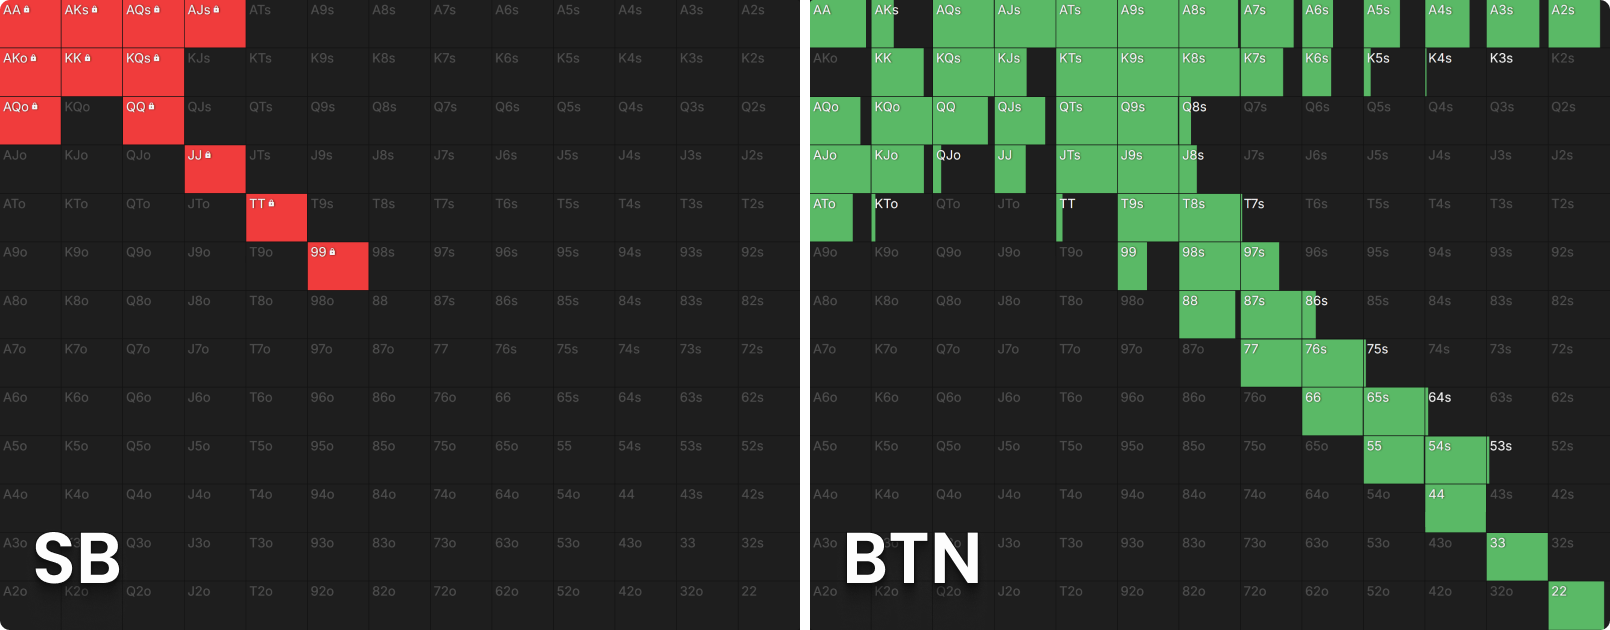
The GTO range is well-rounded, covering lots of boards. It’s also well-balanced, having a sufficient amount of bluffs of varying strength. Something interesting to note is that having board coverage implies having a certain degree of balance, since selecting hands with lower cards in them also means they’ll be weaker hands. To simulate a more common 3-bet range from the SB, I have given them a super tight range of 99+, AQo+, AJs+, and KQs. Notice how a range like this only has cards with rank 9 or higher, so it can not possibly cover boards where ranks 8 or lower are important.
Comparing Performance
Once again, let’s look at what the cost of this is, globally, across the 1755 flops. These are the EVs/Equities/EQRs for the first node:
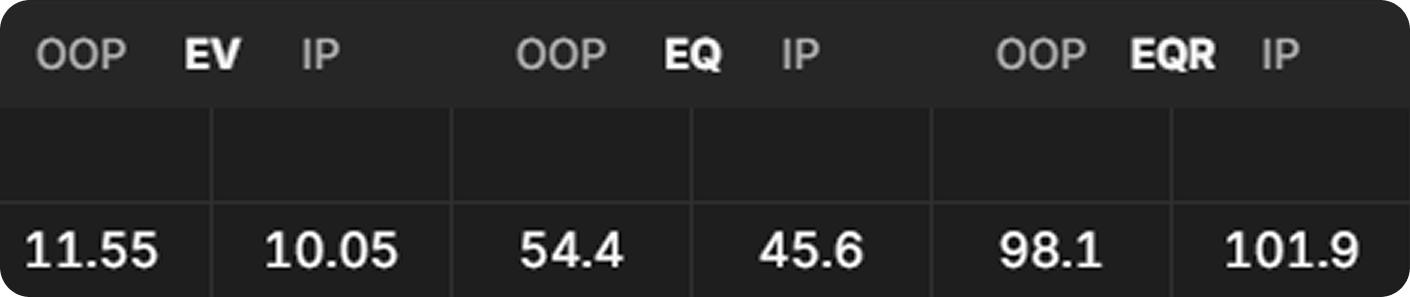
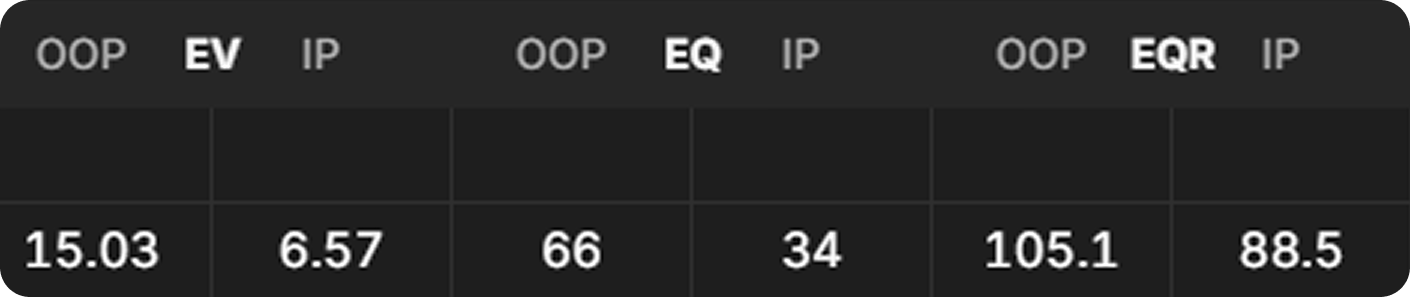
Every metric is elevated for the SB, and the difference in EV is massive. They make an extra 3.48bb on average, which is huge. That sounds great for the SB, so let’s look at the strategy that generates this gain.
SB’s First Action


The SB went from checking 38.6% of the time with their GTO range to just checking 6.7% when their range is overly strong because it lacked preflop bluffs. Meaning, they practically almost always range bet across the 1755 flops.
Those extra bets mostly go into the 69% pot bet sizing, so not only does the SB bet more often, but they do so for a larger size more often. My initial read on this is that, like in the last example, equity denial is so much more important. The SB more often has a strong one pair hand, but less often has straights, straight draws, flushes, or flush draws, so they need to set a worse price for their opponent’s draws.
BTN Response to SB’s Most Common (40% Pot) C-Bet Size


The BTN folds way more often, almost twice as often in fact. They also raise less often.
The SB range is so strong that the BTN has to fold the flop more (a quick reminder, in a perfect world, the BTN would have changed their preflop range in response to such a strong range anyway), and they have to adopt a passive bluff catching strategy when they don’t.
Why don’t we all just play like Nits?
So when the SB has a super tight range, they get to bet all the time, they capture more EV, and their opponent has to fold more often.
Why exactly is it a bad strategy to play such a tight 3-betting range?
I scratched my head about this and eventually got my answer by looking at the one metric that goes down for the SB: equity realization.
It was higher at the start of the hand in No Bluffs World, but these are the global numbers when the SB bets:
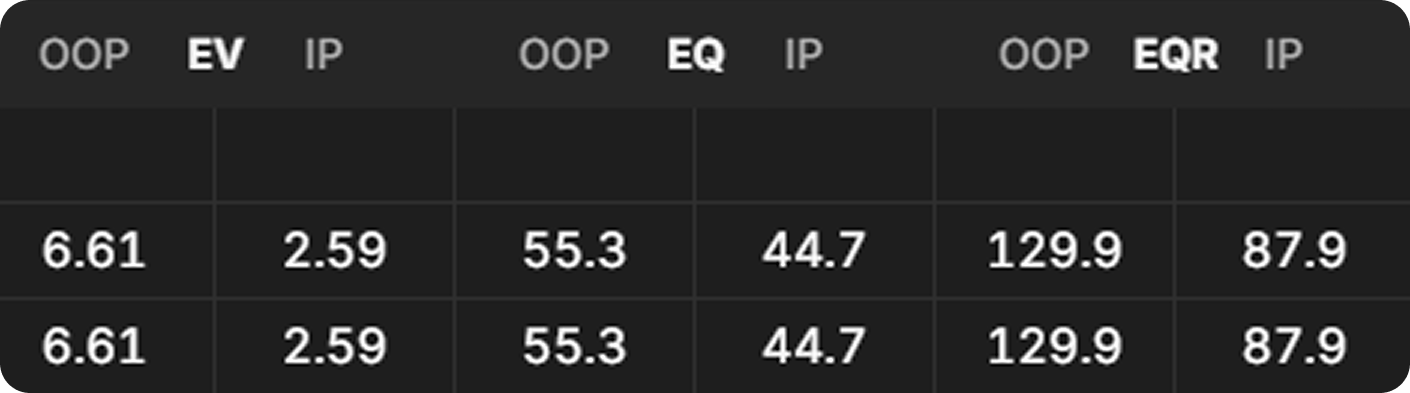
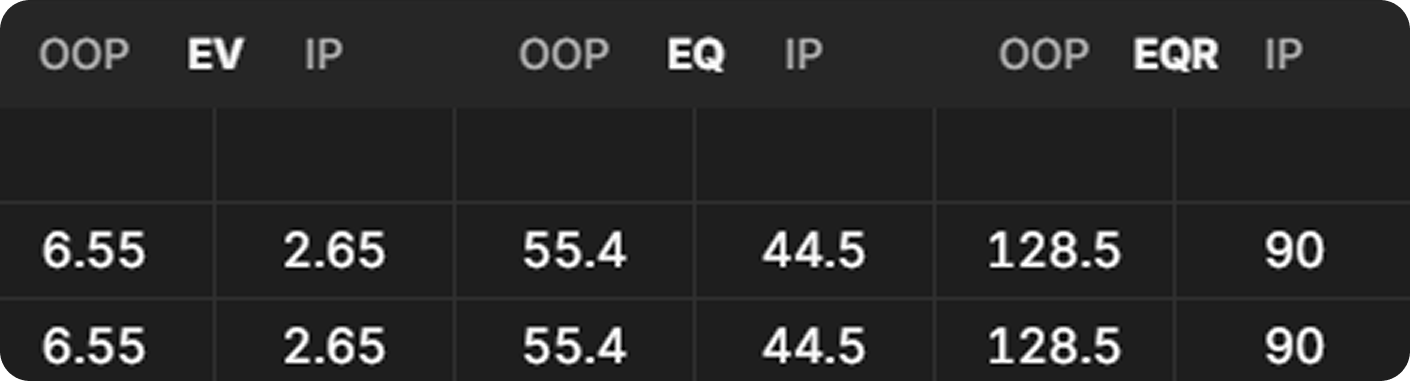
In no-bluffs world, the SB makes less in EV despite having higher equity, and at the same time, their EQR decreases. I’ll spare you going through every node, but this happens with most decision points across these 1755 hands. The no-bluffs range does not realize equity as well as the GTO range.
Going back to the last decision point we looked at, the BTN folded 25.8% of the time in GTO World compared to 44.4% of the time in No Bluffs World. That’s exactly the problem with overly tight strategies; the big hands get paid off much less often compared to when there is the threat of getting bluffed.
Players who play like this, which includes myself at times, get positive reinforcement with this strategy because they win the pot often when they do it. But they don’t win a huge pot very often, nor do they benefit from their tight image with bluffs.
That is the problem with this type of capped range: it is a huge opportunity cost.
I ran this by my coach, Dara O’Kearney, and he suggested that I look at the EV of AA on a random flop to see this demonstrated in detail. In both scenarios, I put up a Q♥T♥2♦ flop. This is what AA makes:
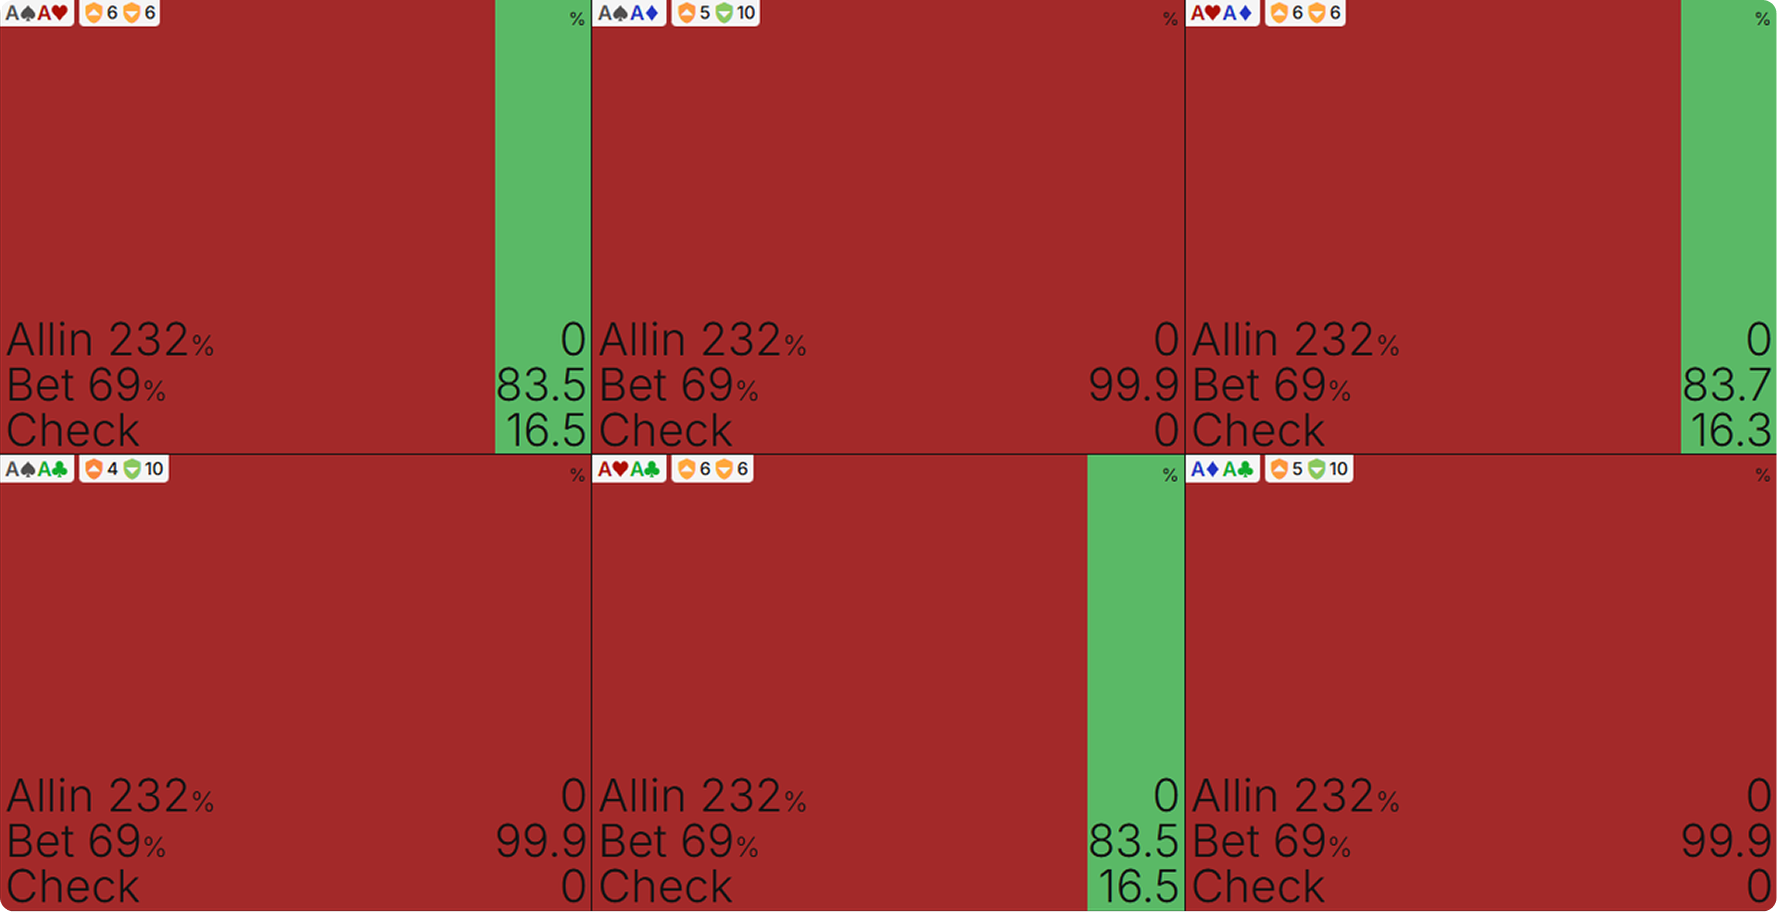
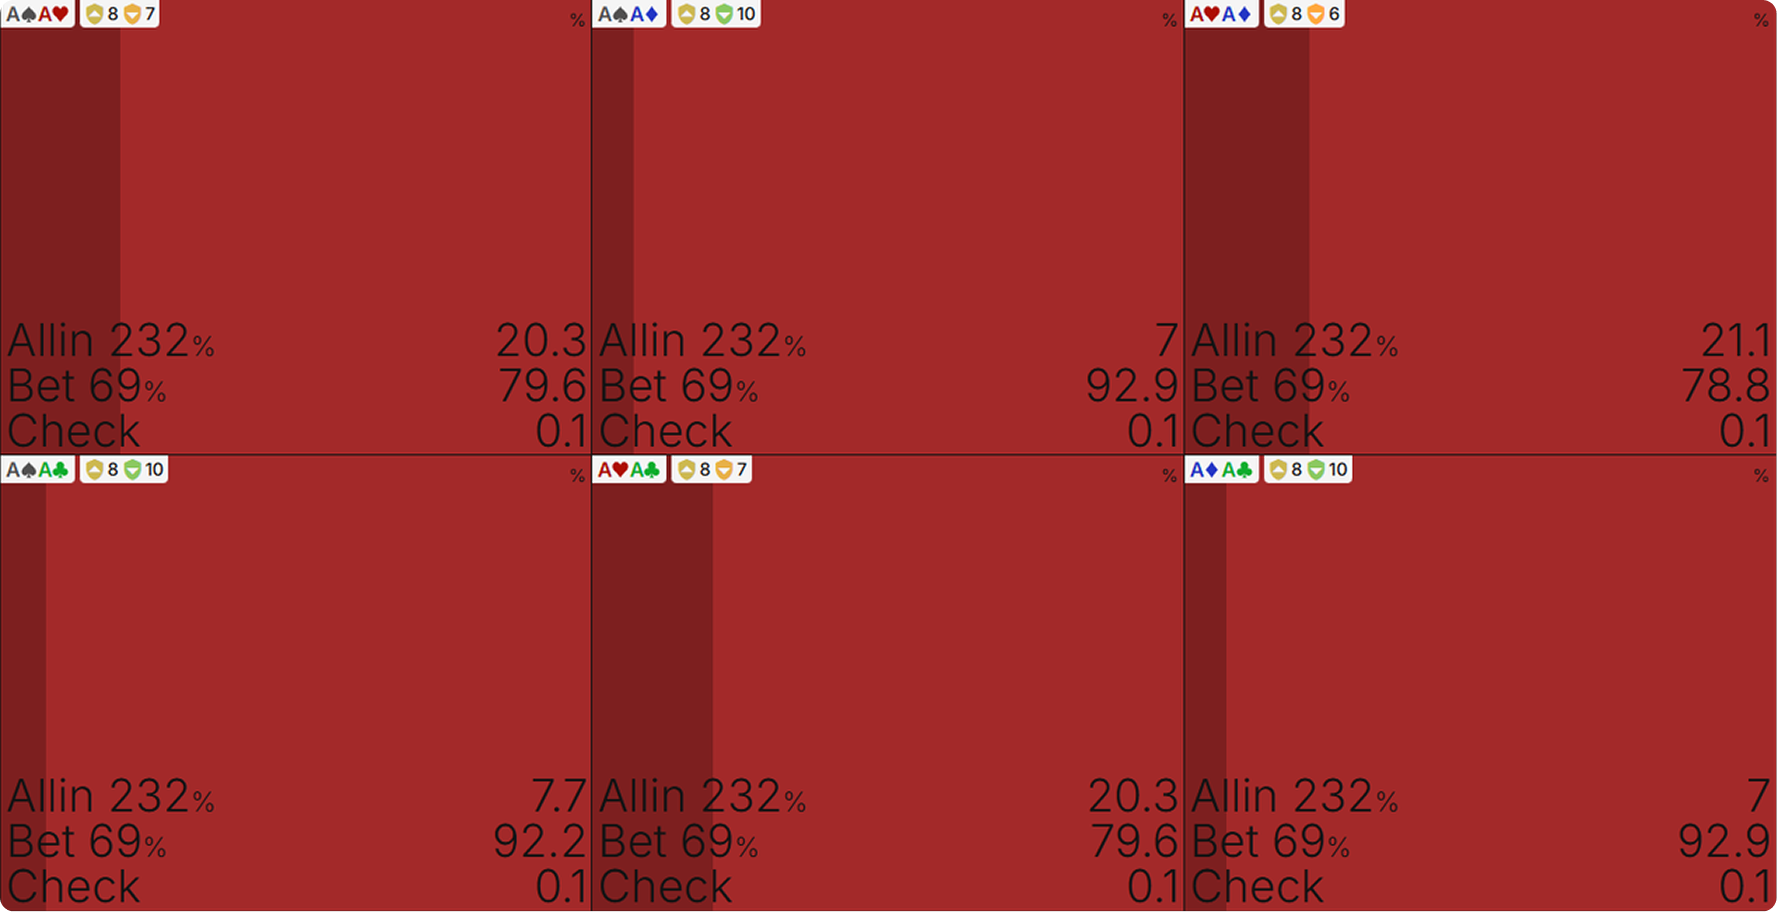
Every combination of AA makes less in the no-bluffs scenario because it does not get called often enough.
When the No-Bluffs Guy Doesn’t 3-Bet
There’s another problem the same player will run into; they’ll have to play a range that’s too wide when they don’t 3-bet preflop (i.e., they just flat the BTN’s open). I ran a report for this, too, where I put all the GTO bluffs that I pulled out of the 3-betting range back into the flatting range.
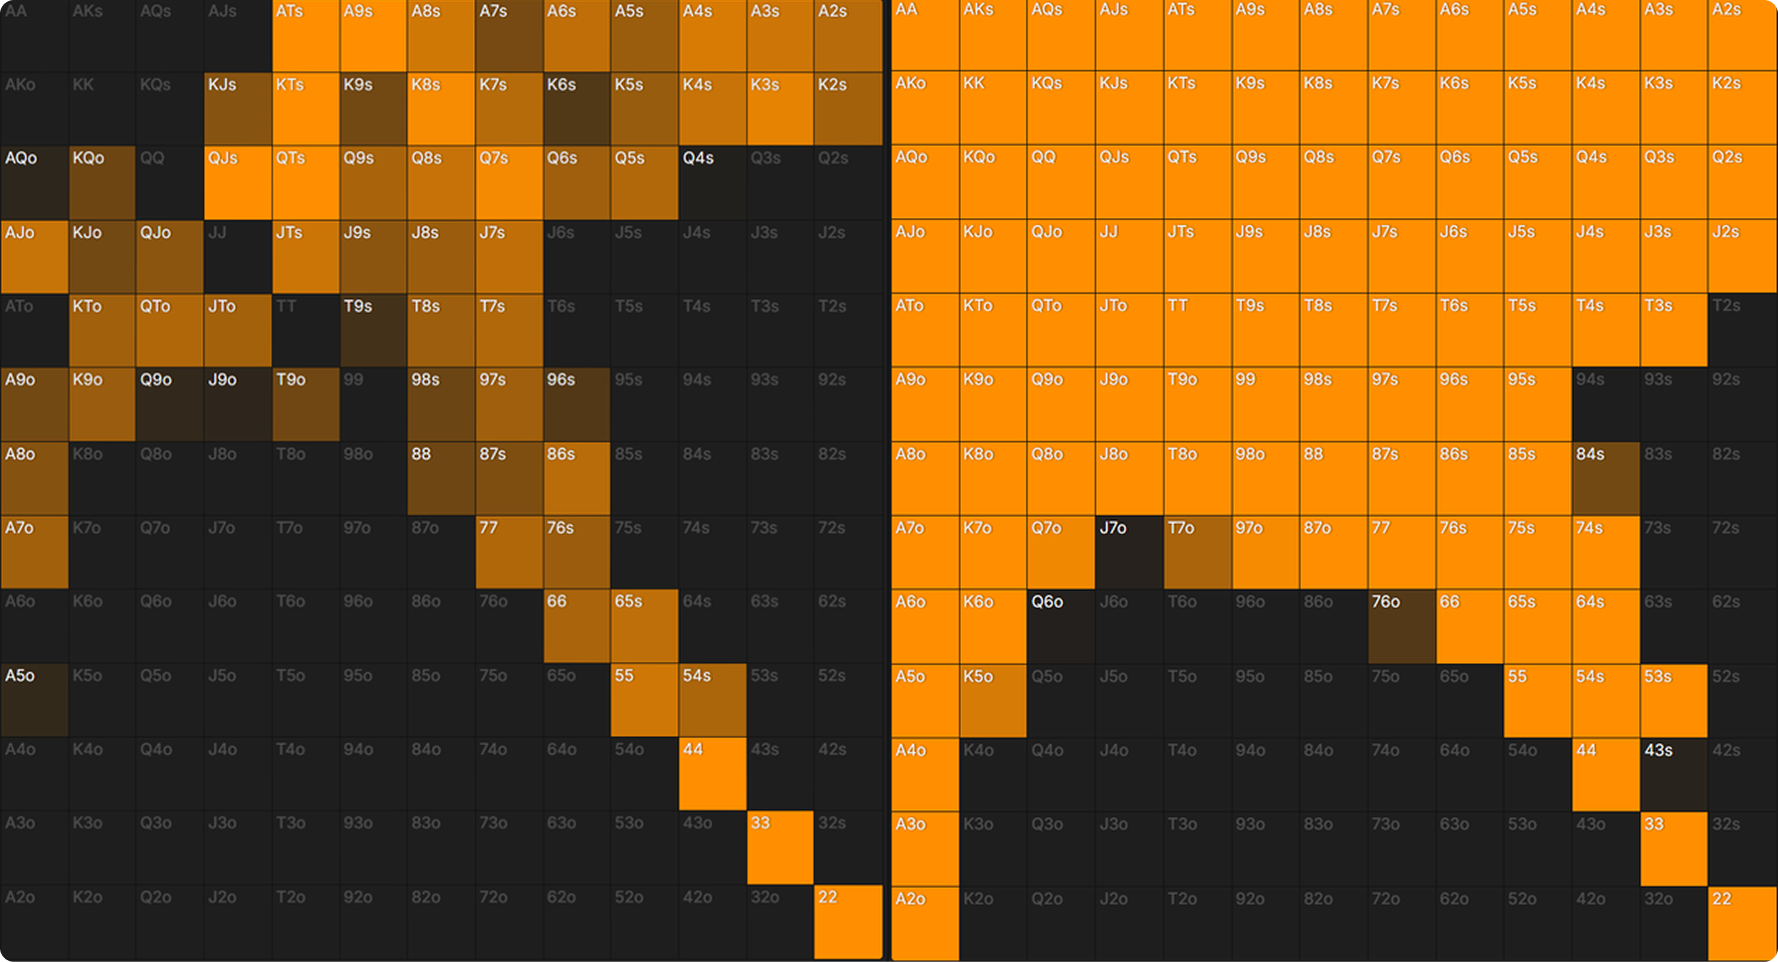
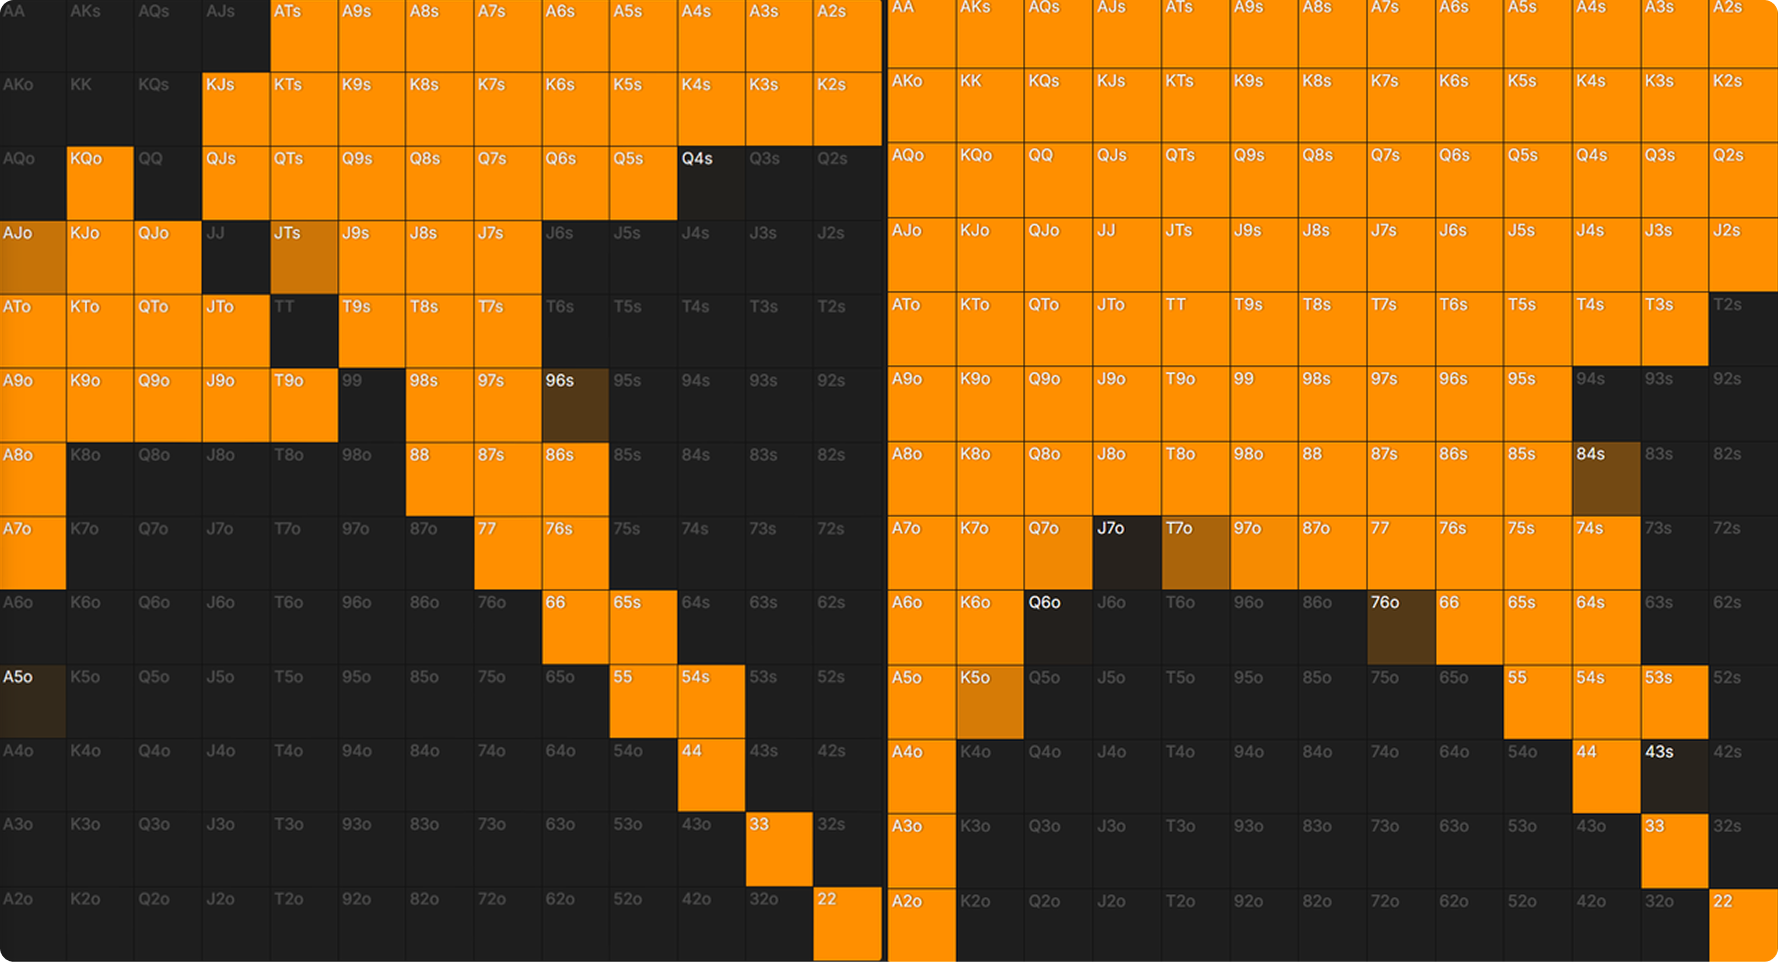
I won’t go into detail here, but a quick look at the EVs:
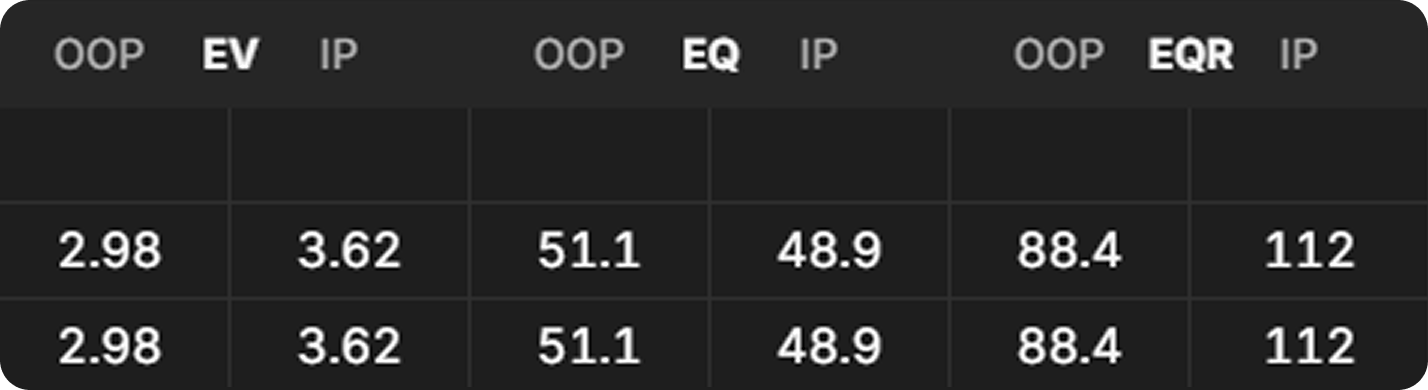
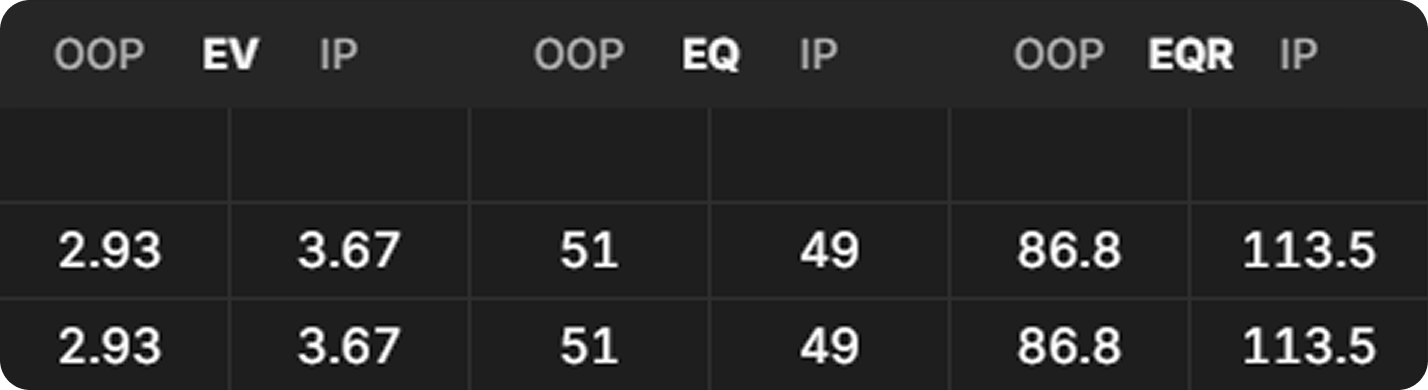
In no-bluffs world, the SB loses 0.05bb on average because their range is too wide now. You won’t see much difference in the overall strategy, but it is a leak. And an important reminder that sometimes the biggest leaks come from branches of the game tree you wouldn’t think to look at first.
Conclusion
Capping your range by not having board coverage obviously leaves you vulnerable on low-connected boards, but we have seen that it also hurts your EV overall. The custom aggregated reports have shown us that the broad exploit against these players is to both lead and check-raise more frequently.
When you cap your range like this, it seems great at first glance. We can always bet, and our opponent will fold often. The problem with this is the perennial problem the nit faces: not getting paid. Over-folding is bad for us when we have strong hands, and we don’t get to realize our equity anywhere near as much as we want.
These are just two experiments I was able to run with custom aggregated reports. They are proving to be an excellent tool for forming a picture of the broad strategic adjustments, which then paves the way for understanding the universally applicable mechanisms that drive those adjustments. This sort of preparation will help you to digest the details of the 1755 individual flops more easily.