How Payout Structures Reshape Postflop Strategy


Overview
Is all ICM pressure the same, or should we tailor our postflop strategy to different payout structures? How big of an error is it to take the same default final table strategy into a tournament that features a more top-heavy or a more flat payout distribution?
I have already written about this with a more general approach, but today I am delving into the specifics of postflop play. For this purpose, I am going to leverage the Custom Aggregated Reports to get a view of how dramatically postflop strategies change when payout structures differ.
Three Payout Structures
In the following reports, everyone has 30bb at the final table (FT). Let’s imagine it’s the start of a shootout FT to explain this unlikely scenario. The reason I have given everyone the same stacks is so that any differences in strategy are due to the differences in payout structure, not the stacks at the table.
Each report is for HJ vs BB, single-raised pot.
We will consider the following three payout structures. The first one is the standard payout structure for a 200-runner tournament in GTO Wizard. The other two are more top-heavy and flatter, but with the same overall amount of money on offer at the final table.
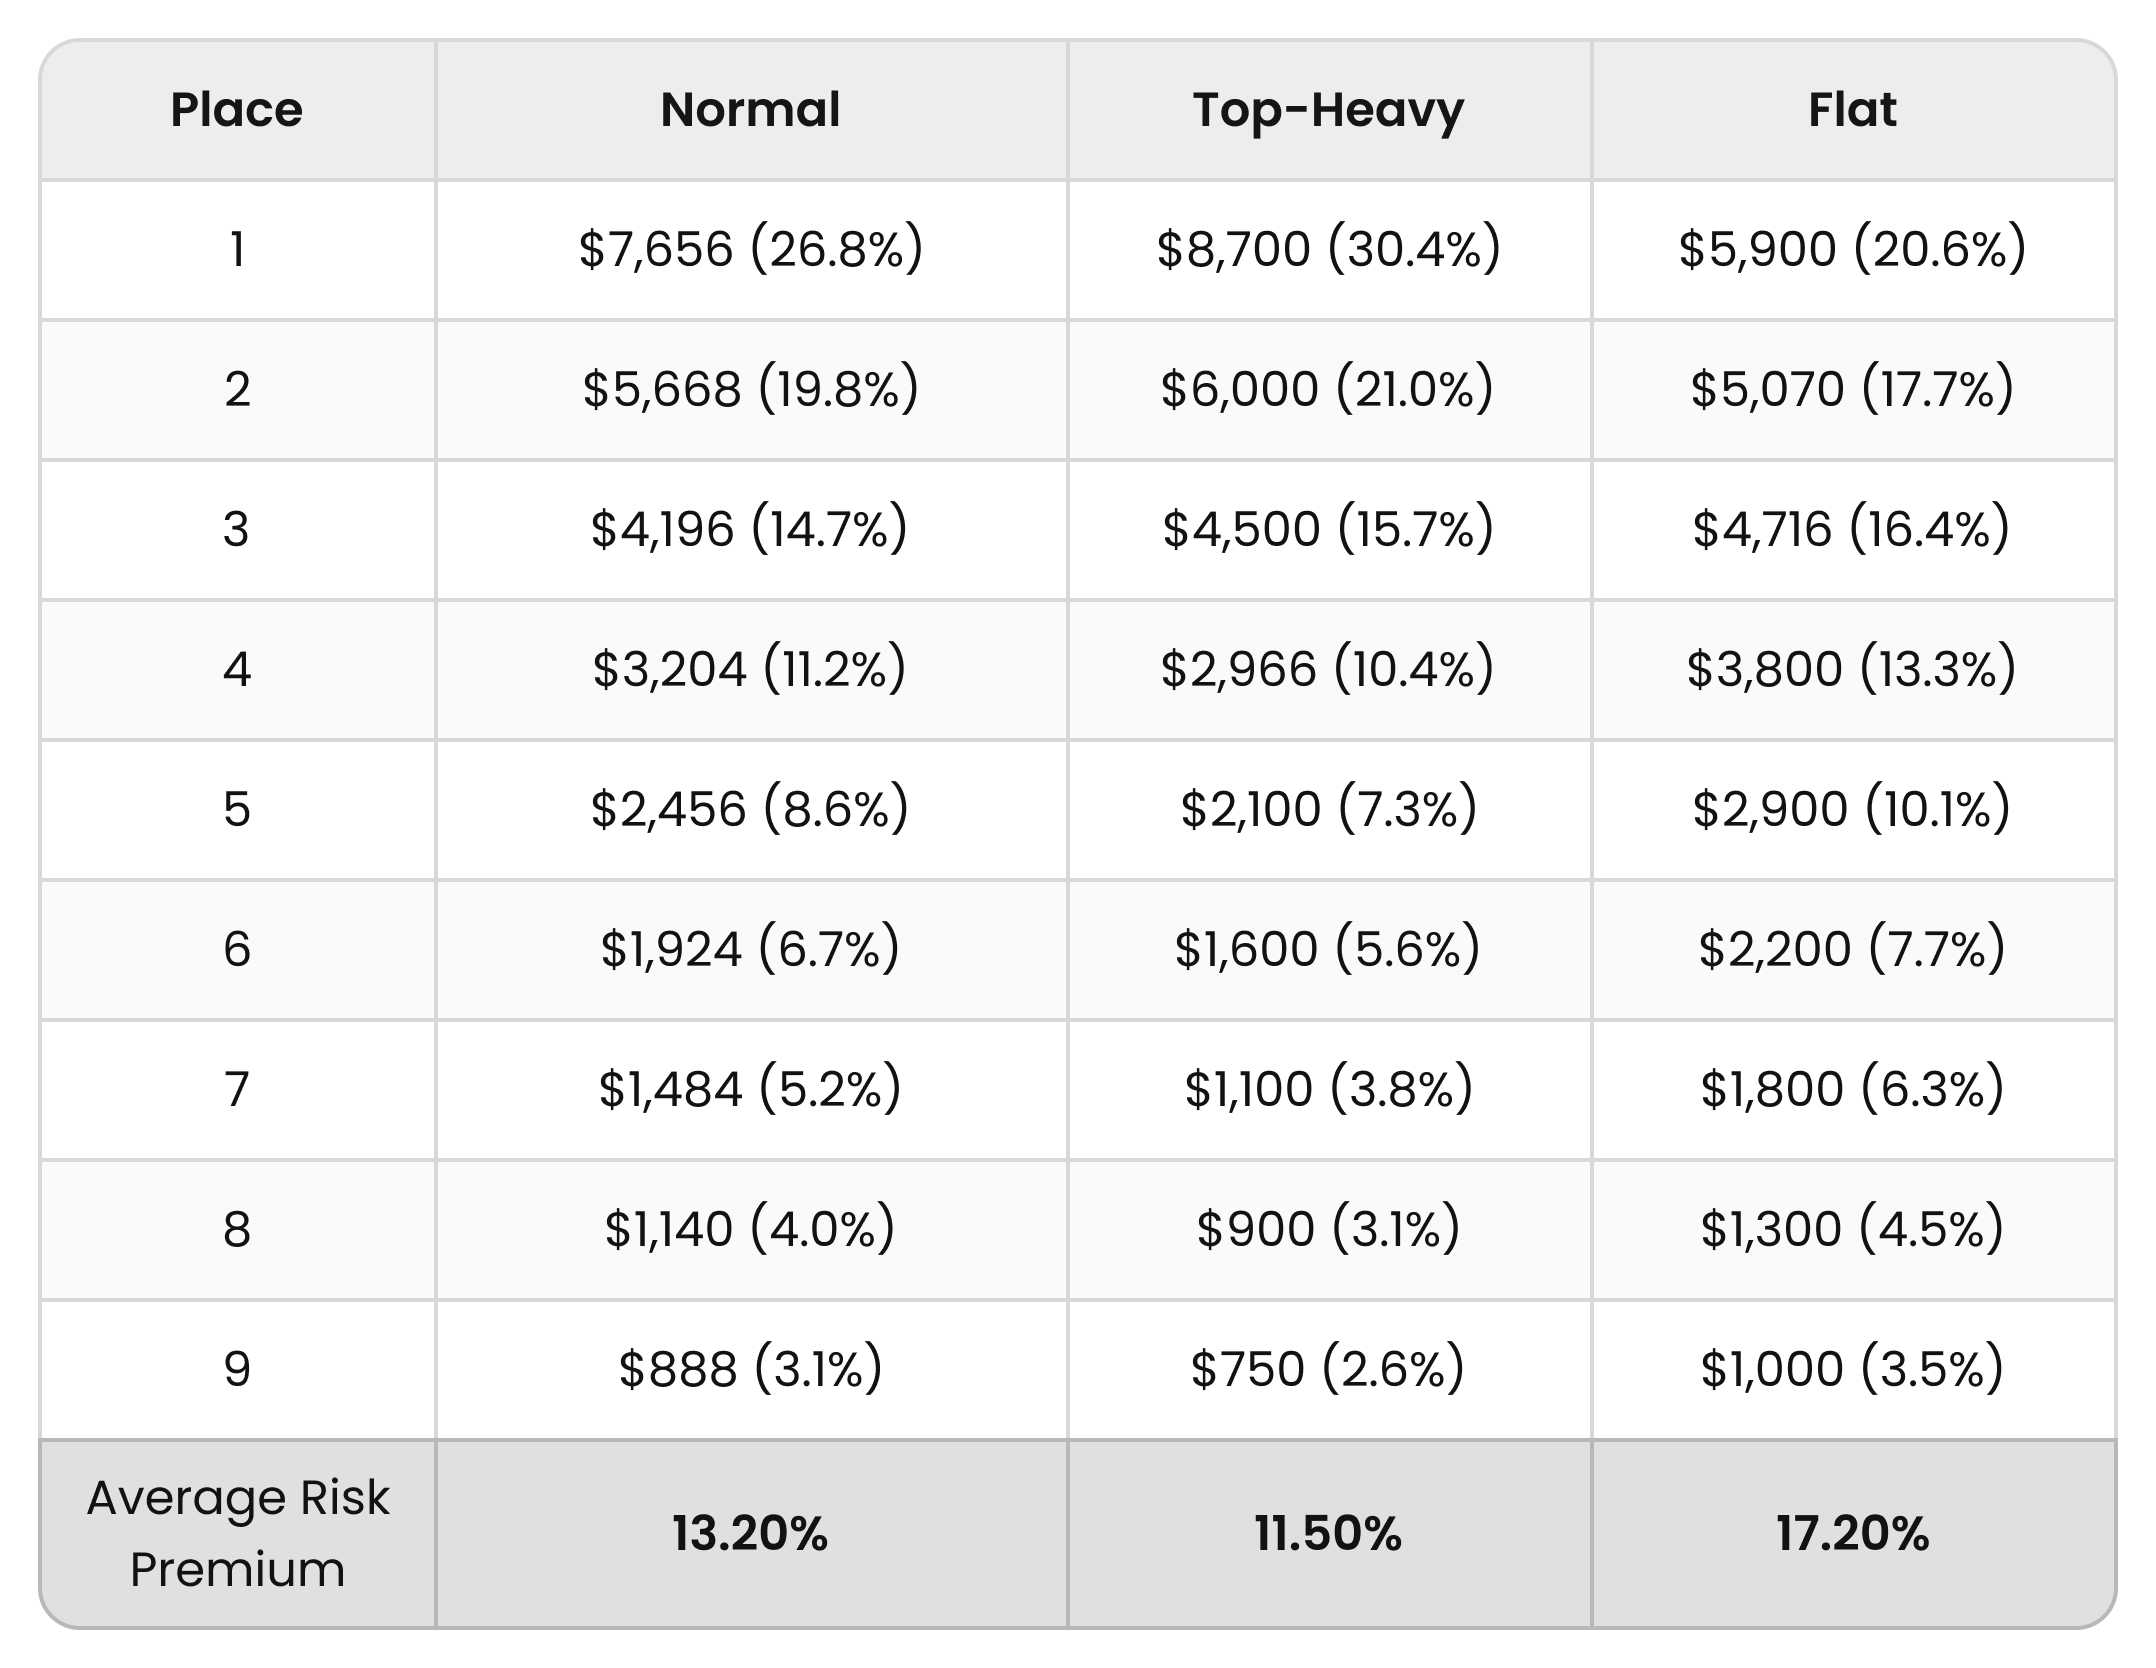
We can see a 5.7% difference in the average risk premium between the opposite ends of the payout spectrum (top-heavy vs. flat). The risk premiums are by far the highest at the flat payout final table.
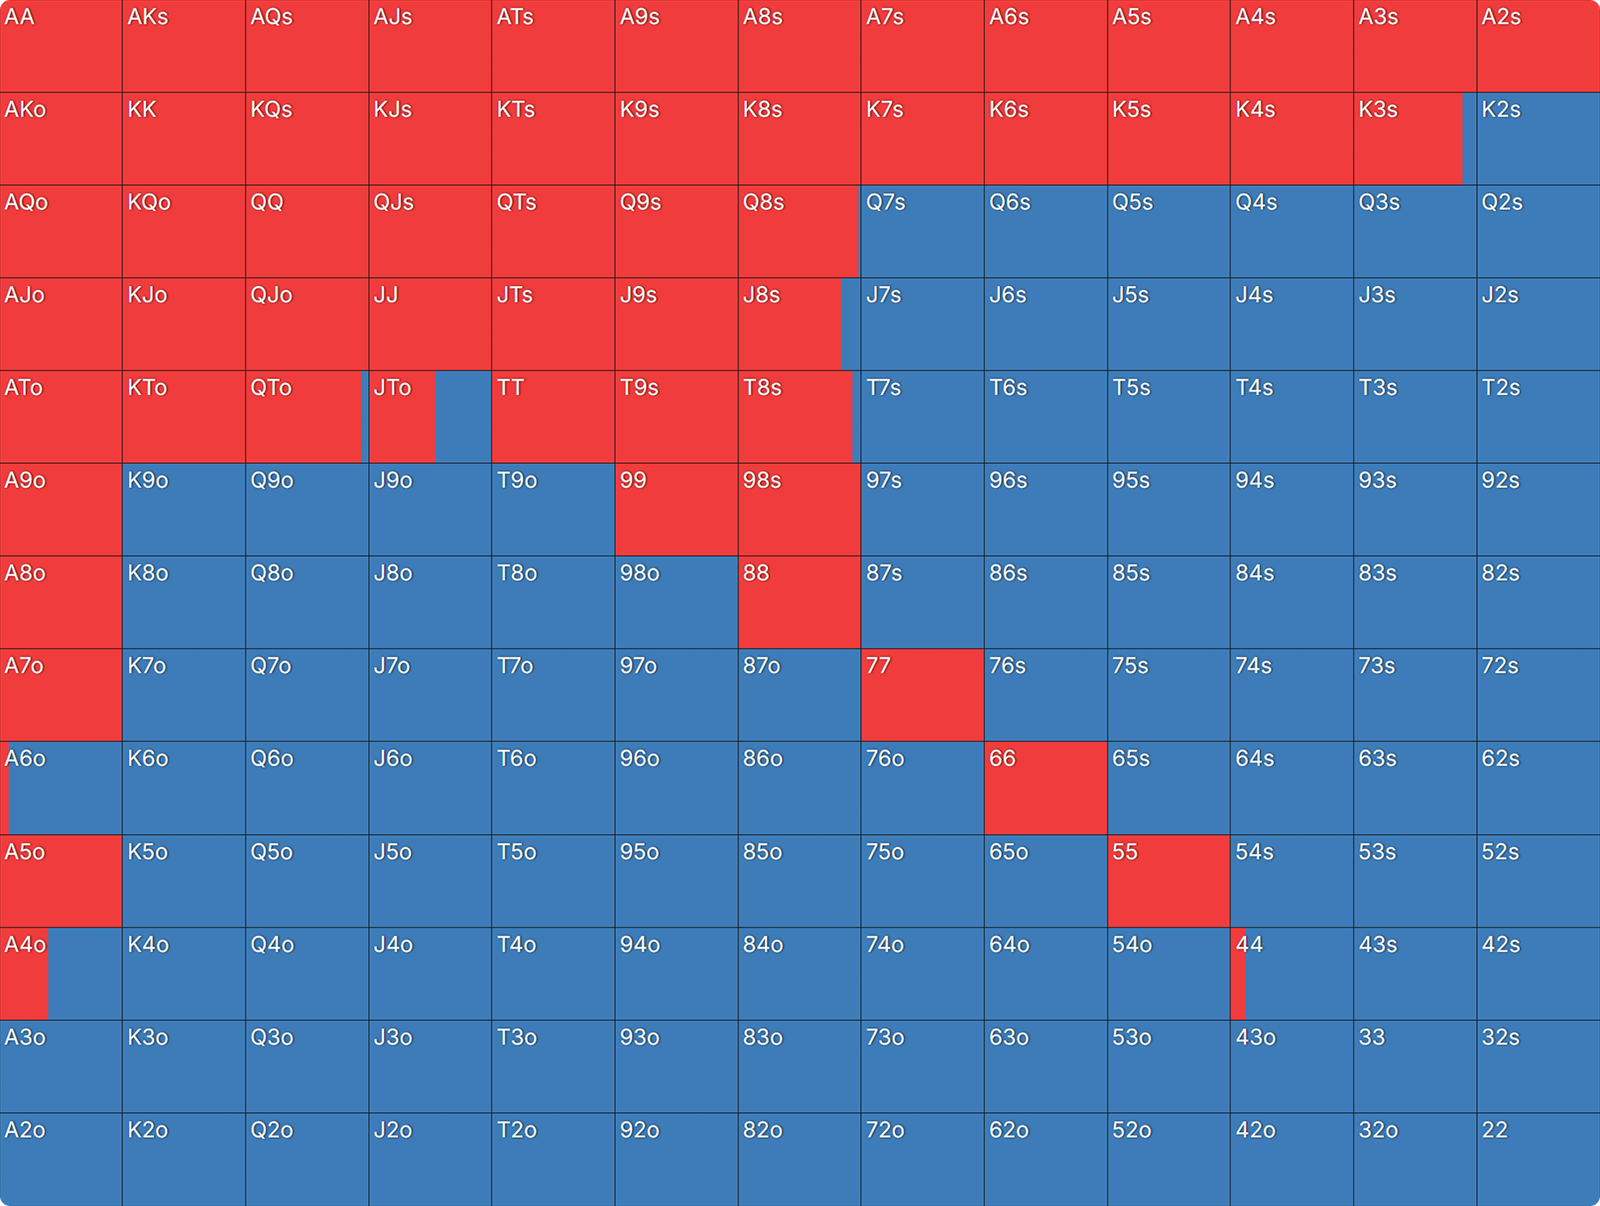
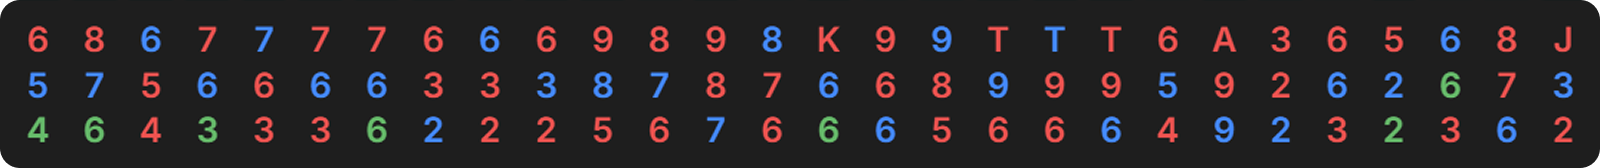
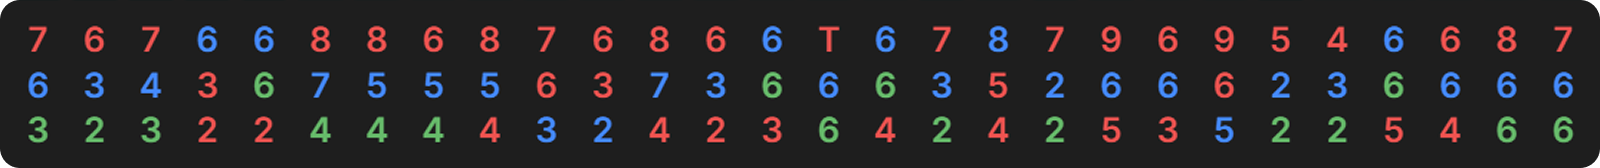
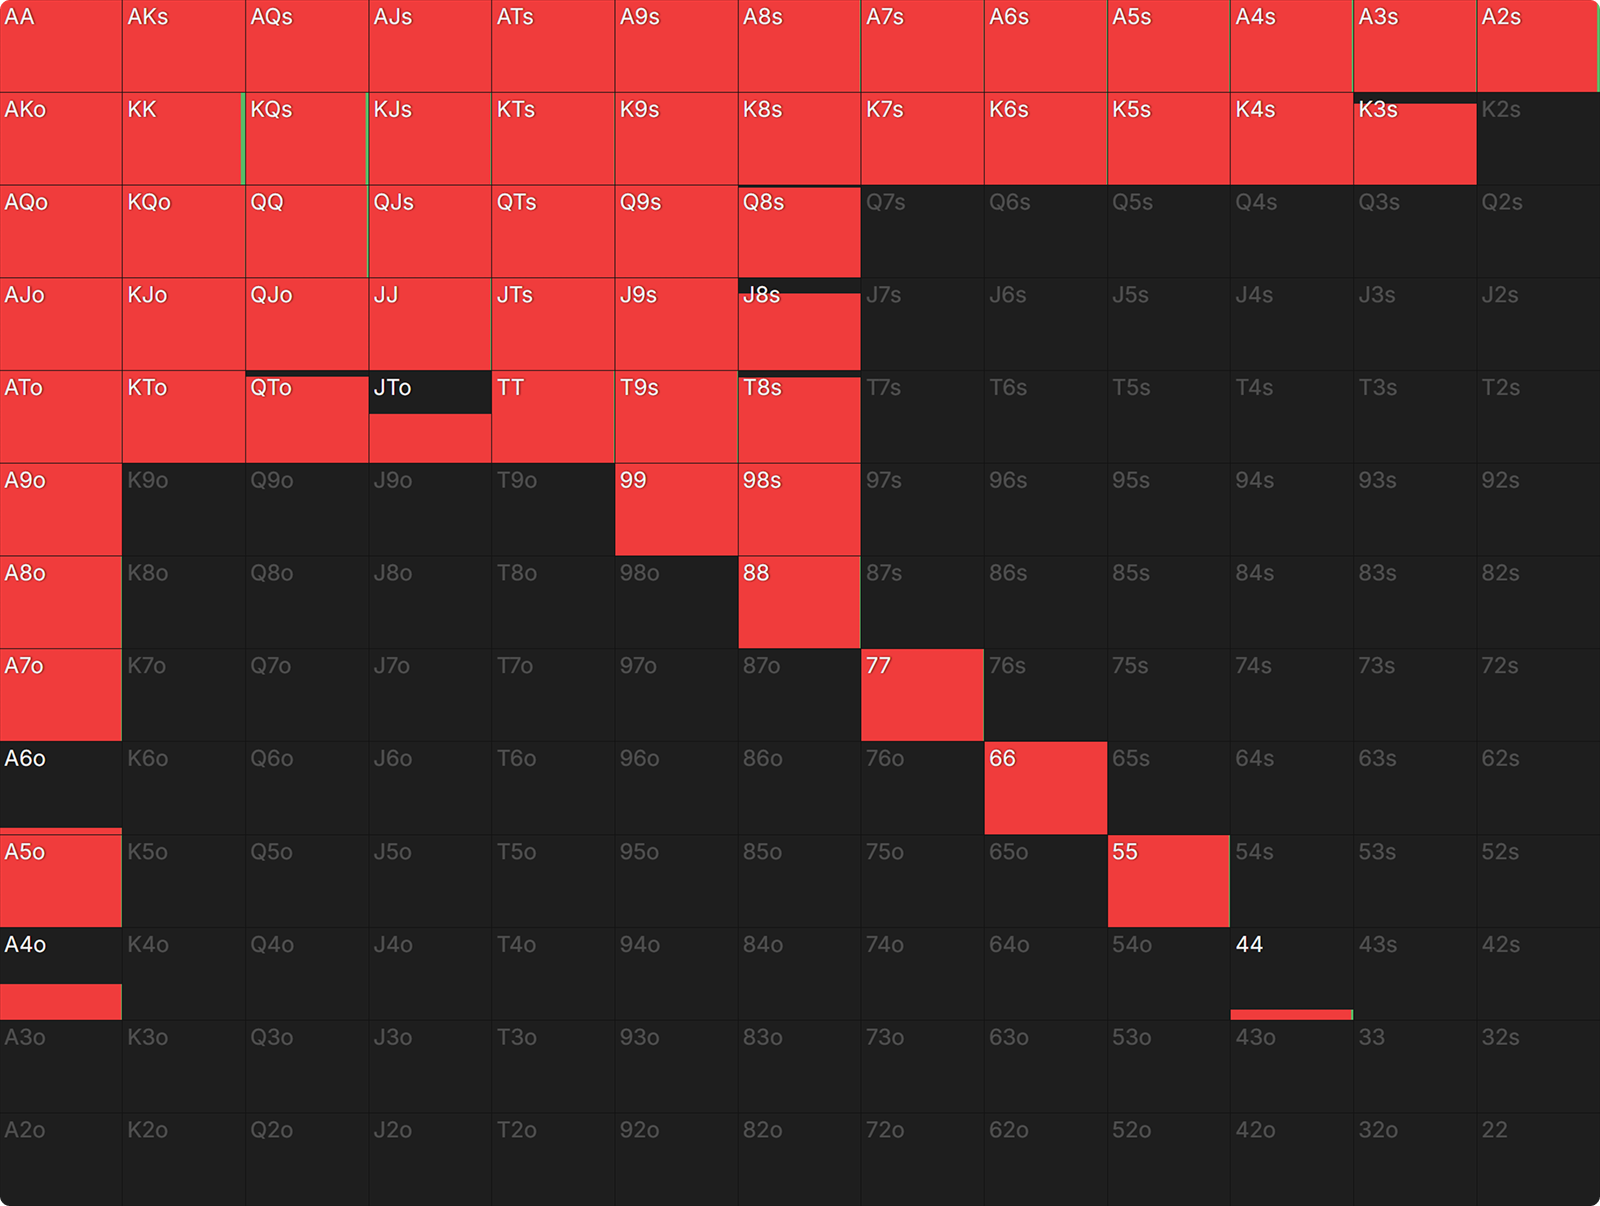
Both players’ preflop ranges are fixed and identical for all three FT environments. These were the ones I used:
HJ vs BB: 30bb Symmetric, ICM (FT of a 200-player MTT)
{{grid: 2}}
{{/grid}}
Disclaimer: This is not a perfect pair of ranges to use in all three examples. If both players were playing optimally, the top-heavy ranges would be wider, the flat payout ranges would be tighter and more blocker-heavy. However, doing it this way makes it easier to compare the strategies and the ICM effect.
The BB Check Node
In the first node, the action is on the BB; they’ll usually check on most flops. This is what the aggregated action frequencies from the three reports look like, across every possible flop:

If I am honest, I don’t think the changes in the frequencies are dramatic enough to pass comment here. I think this is mostly the wide defending range vs. the tight opening range dynamic dictating the strategy, with ICM only having a small influence.
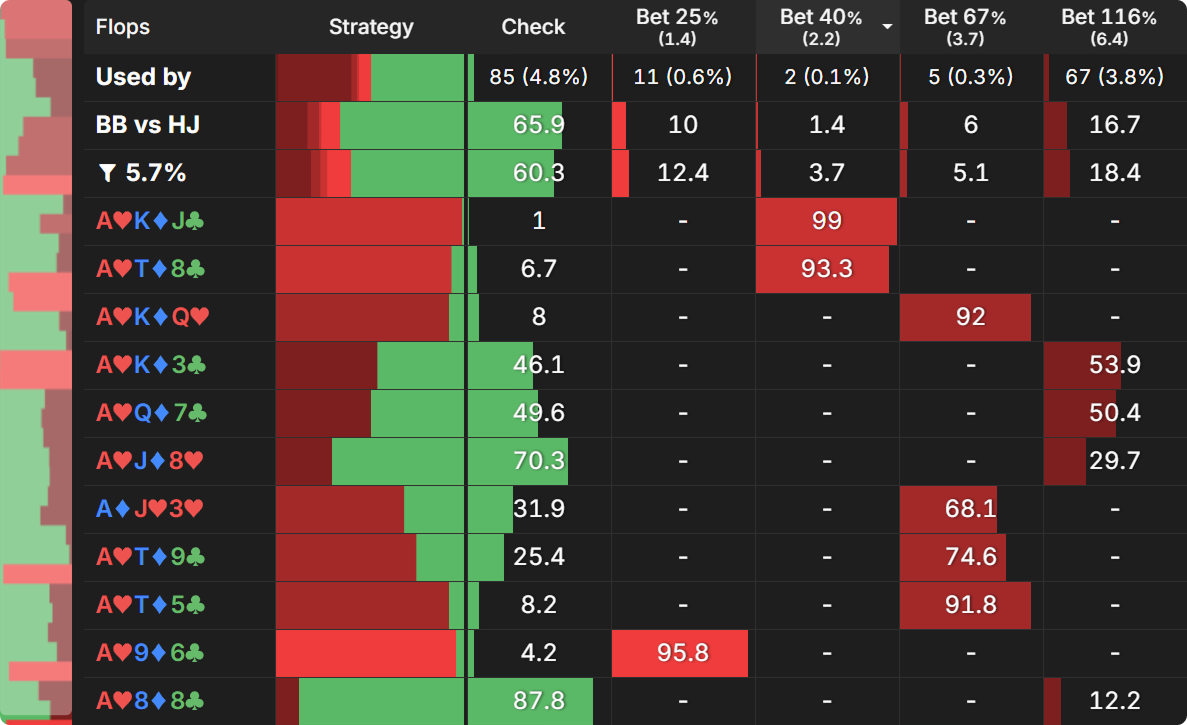
There is a difference, however, in the types of flops where the outlier action of leading takes place. Filtering so that all bet sizes are included, the following are the most commonly lead boards, sorted by leading frequency:
Flops Where BB Leads
Normal FT
Top-Heavy
Flat
At the normal final table, the most commonly lead boards are mostly medium and connected with lots of draws. At the top-heavy final table, it’s very similar, but a little bit less connected.
The flat final table is much more weighted towards lower, connected boards and even more so, paired boards where the pair is a 6 or a 2.
All three collections of boards are ones the HJ is unlikely to have hit, and the BB has a lot of nutted hands on. At the flat final table, the strongest possible hands are stronger; more full houses and quads, compared to the straights on the other boards.
Due to the effect of payouts (reflected in the risk premium, which is much higher at the flat final table), we need a much stronger hand to lead out when laddering is more important.
When It Checks to the HJ
Moving on, let’s look at what happens when the BB checks.
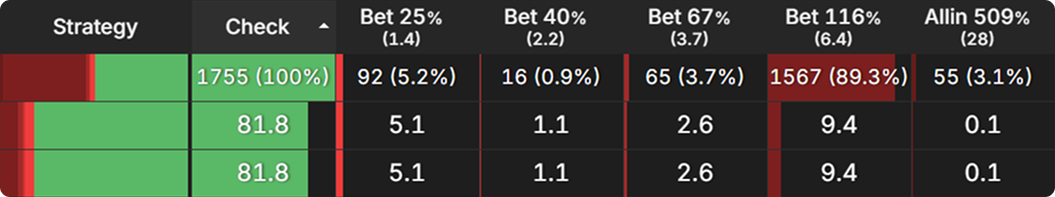
Now we are seeing a significant divergence in the strategy. At a regular final table, the HJ checks back quite often, ~71% of the time. For context, if this were Chip EV, they would only check back ~15% of the time across all flops. What this implies is that there would often be boards that get a range bet, but betting becomes more selective when ICM is significant.
The HJ checks back much less often at a top-heavy final table, ~66% of the time. This makes sense given that the top prizes are much more significant, bringing the structure closer to Chip EV. So we have less incentive to preserve our stack, resulting in a greater incentive to grow pots, even if that increases the odds of us getting eliminated. Likewise, at the flat final table, we see a lot of checking (~82%). This is essentially prioritizing pot control and chip preservation. Laddering is much more valuable in this structure, and it’s hard to bust when we check down our hands.
Proportionally, there is more small betting at the flat final table, and more overbetting at the top-heavy final table. Again, we are motivated to keep the pot smaller when we don’t want to miss pay jumps, and we are happier to make the pot bigger when the reward for winning all the chips is greater.
Notice in all three environments how the medium bet sizes are used the least. This is the ‘min or all-in’ effect that ICM has on postflop betting strategy, covered on this blog before. The solver tends to take low-variance lines, which can be accomplished either by a small bet (to keep the pot under control) or a big bet, which will generate a lot of folds.
The Ace-High Flop
What I have found helpful with Custom Aggregated Reports is to use filters to isolate specific types of flops, which makes it easier to identify where strategy changes significantly. For example, you might want to look at paired flops or monotone flops.
We have already identified that there is a significant change in strategy generally. Now, let’s look at some specific hands.
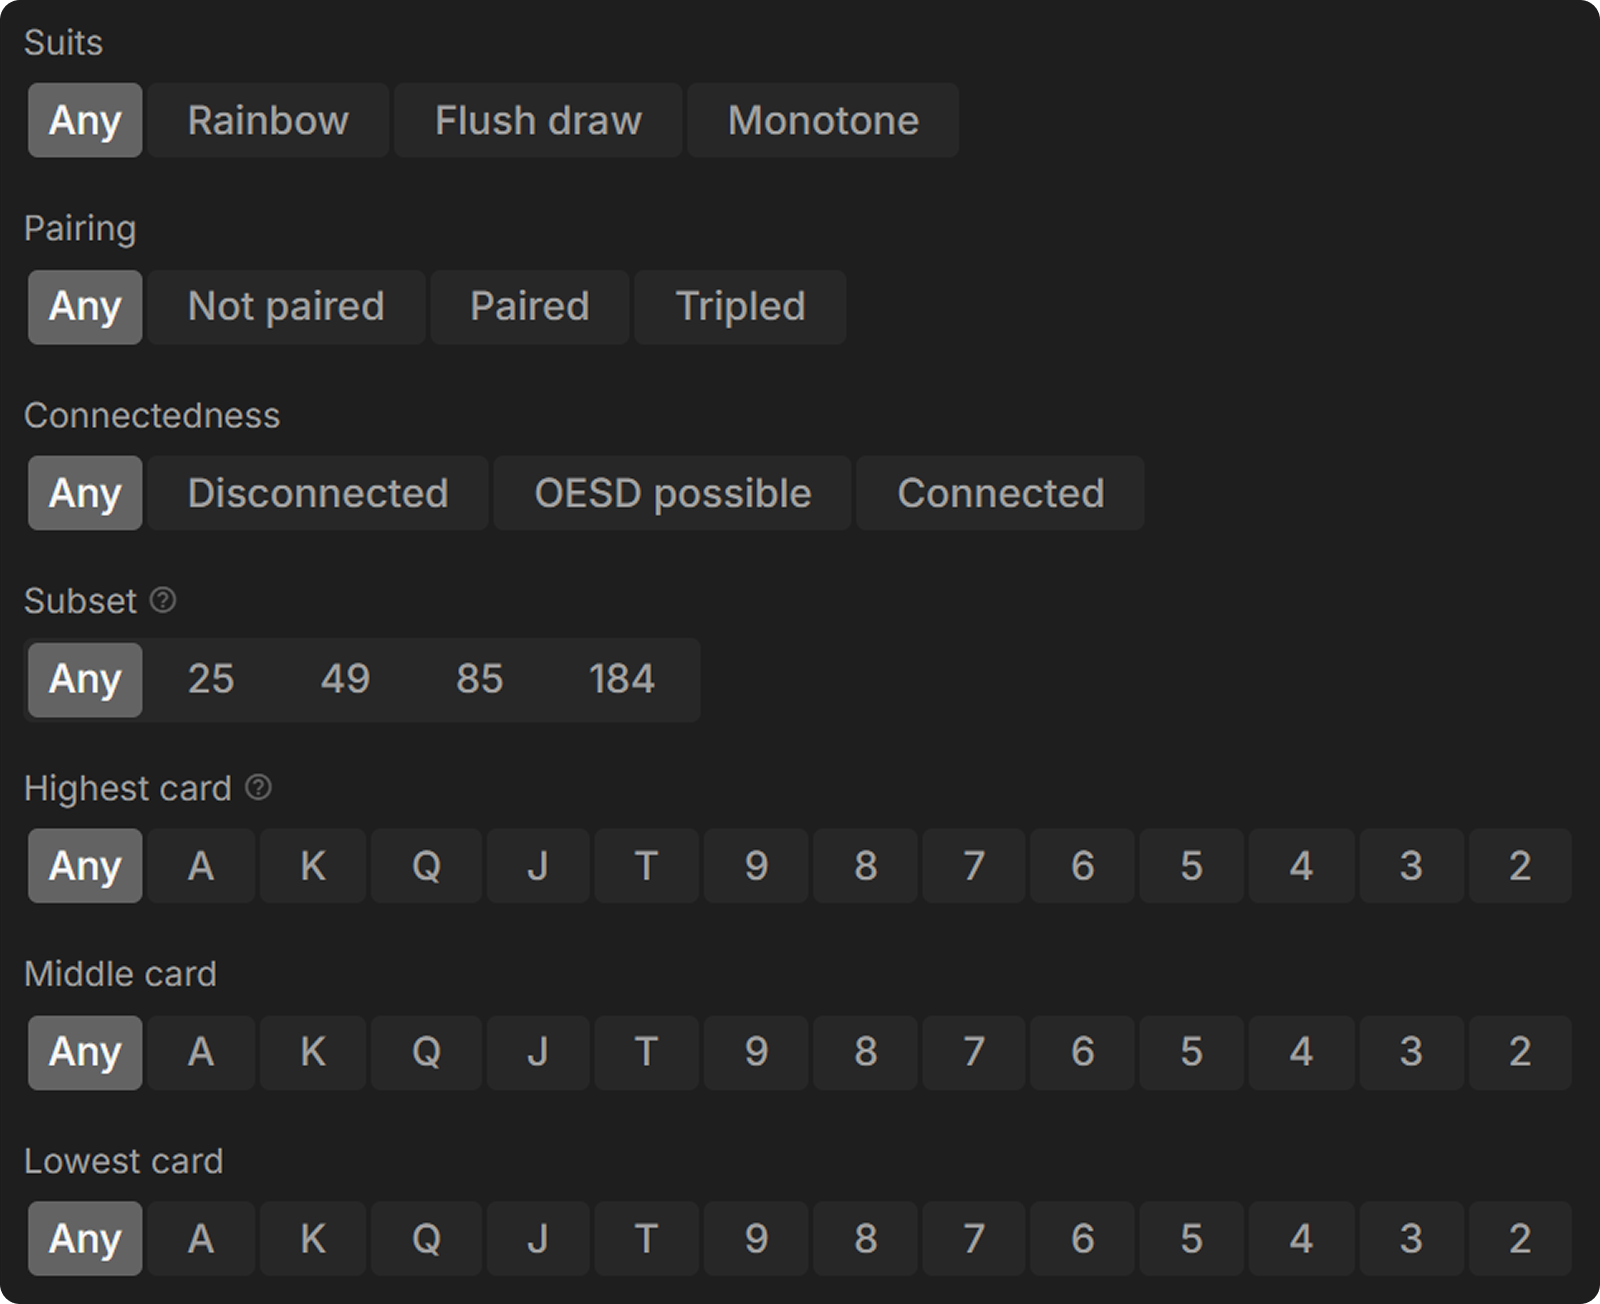
For this particular experiment, I used the ‘Subset’ filter to get a smaller (more manageable) set of flops that together represent all possible flops. For each one in the subset, the strategy is shown just like in a full flop report:
It took a bit of trial and error, but I spotted a shift with the following hand.
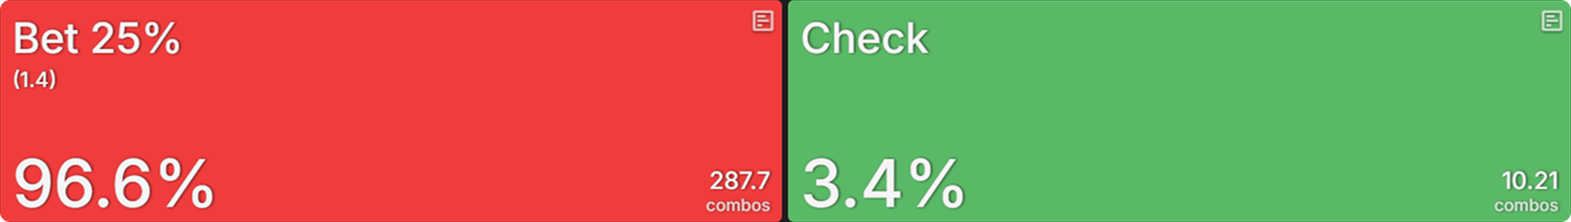
The peculiar flop is A96r, where the HJ has a considerable range advantage, but the BB makes more second and third pairs.

With all three payout structures, the BB checks 100% of the time. This is what the HJ then continues to do on each type of final table:
Normal FT
{{grid: 5fr 1fr}}
{{/grid}}
Top-Heavy FT
{{grid: 5fr 1fr}}
{{/grid}}
Flat FT
{{grid: 5fr 1fr}}
{{/grid}}
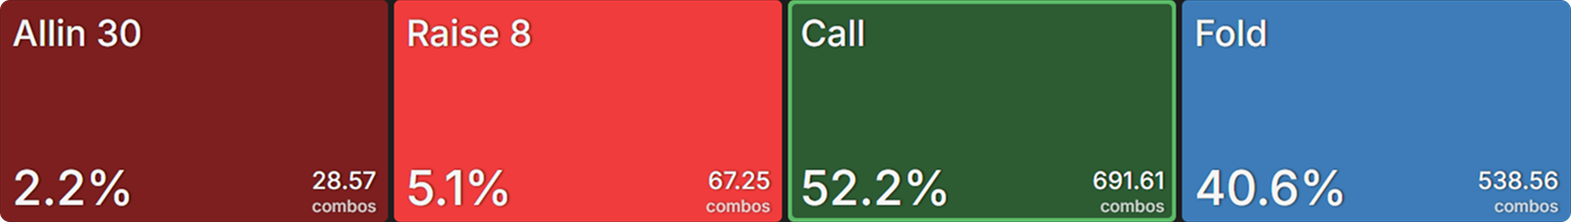
Practically speaking, there is only a small difference between a normal and a flat final table, which is virtually the same as what it would be in Chip EV. This is a range bet for 25% pot. At the top-heavy final table, a more polarizing 67% pot bet size was used, causing the HJ to check back 25% of the time.
It initially surprised me to see the payout structure that generated the least ICM pressure being the one where the strategy deviated from chip EV the most, because in theory, the lower the risk premium, the closer you get to cEV.
The reason for this, I believe, comes down to the way in which ICM varies the most between money bubbles and final tables. There is less ICM pressure overall compared to the money bubbles. This means there’s relatively more reason to accumulate chips on final tables. In this example, it may seem paradoxical, but there is more upside to playing for bigger pots as we are in the business end of the tournament.
The ‘Action’ Flop
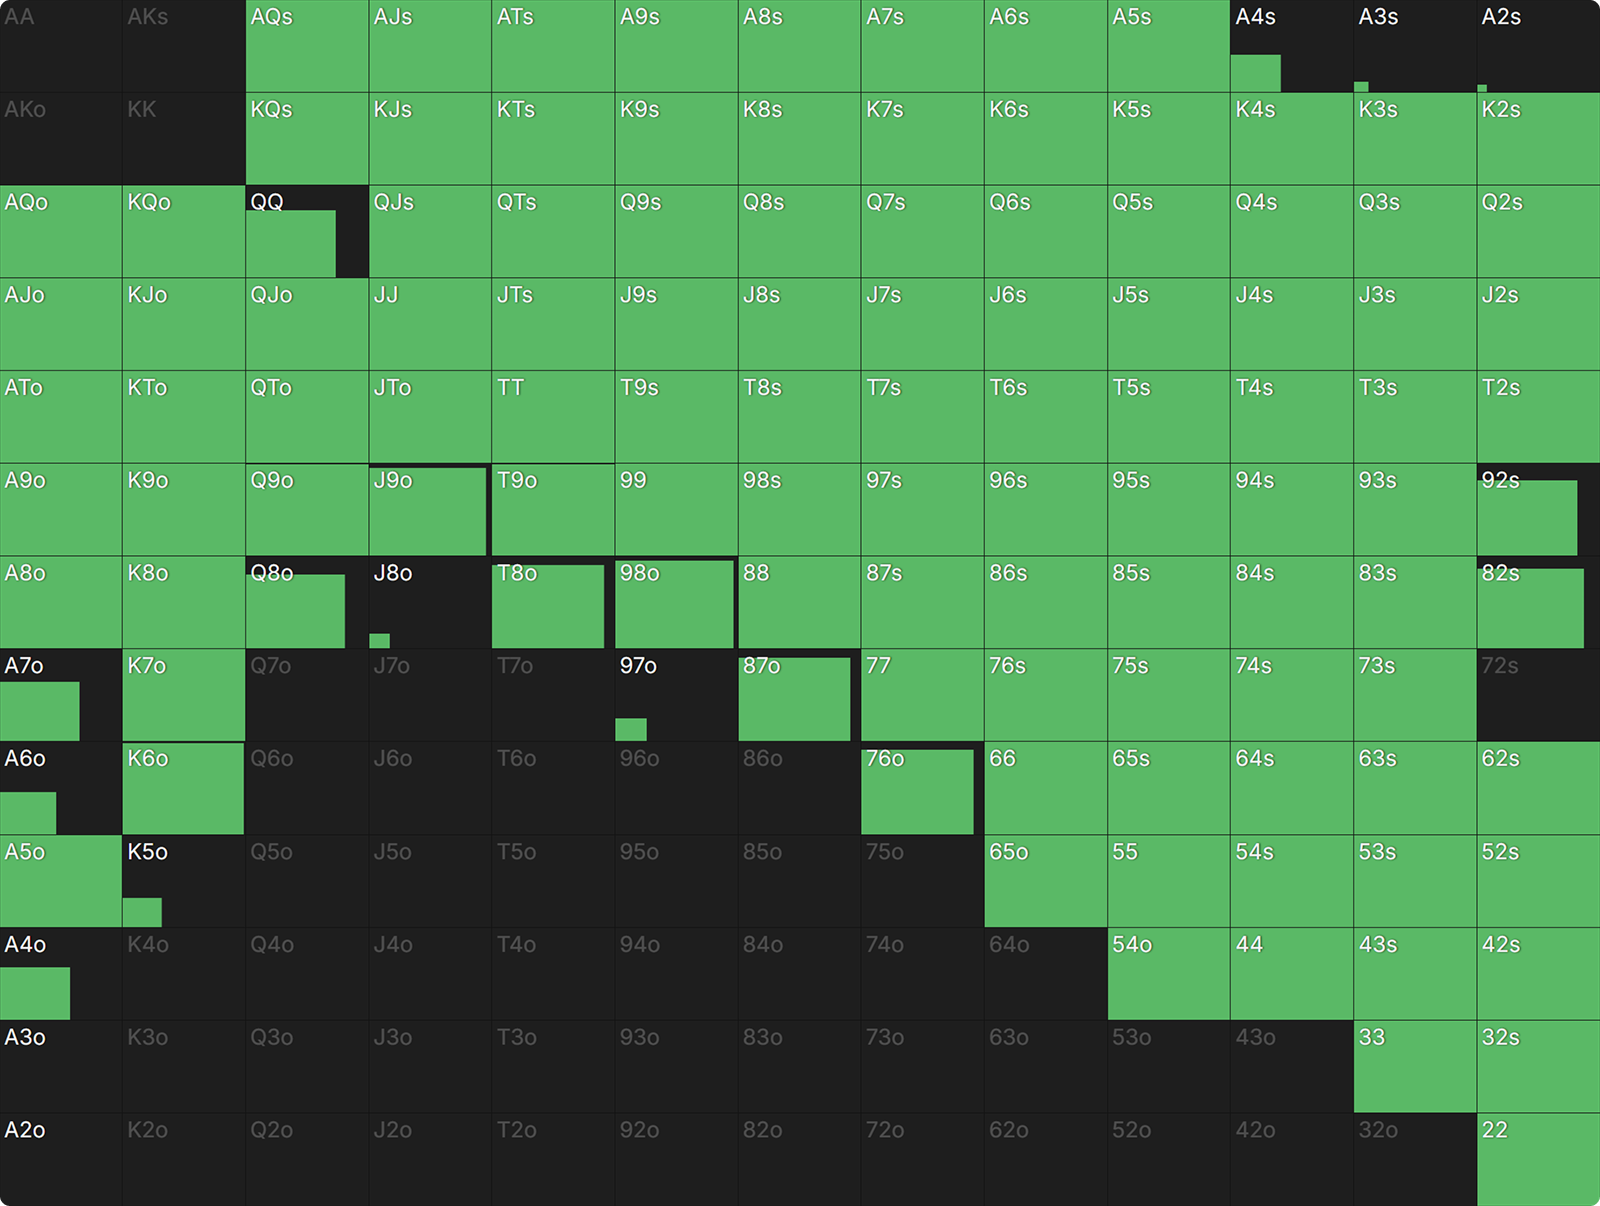
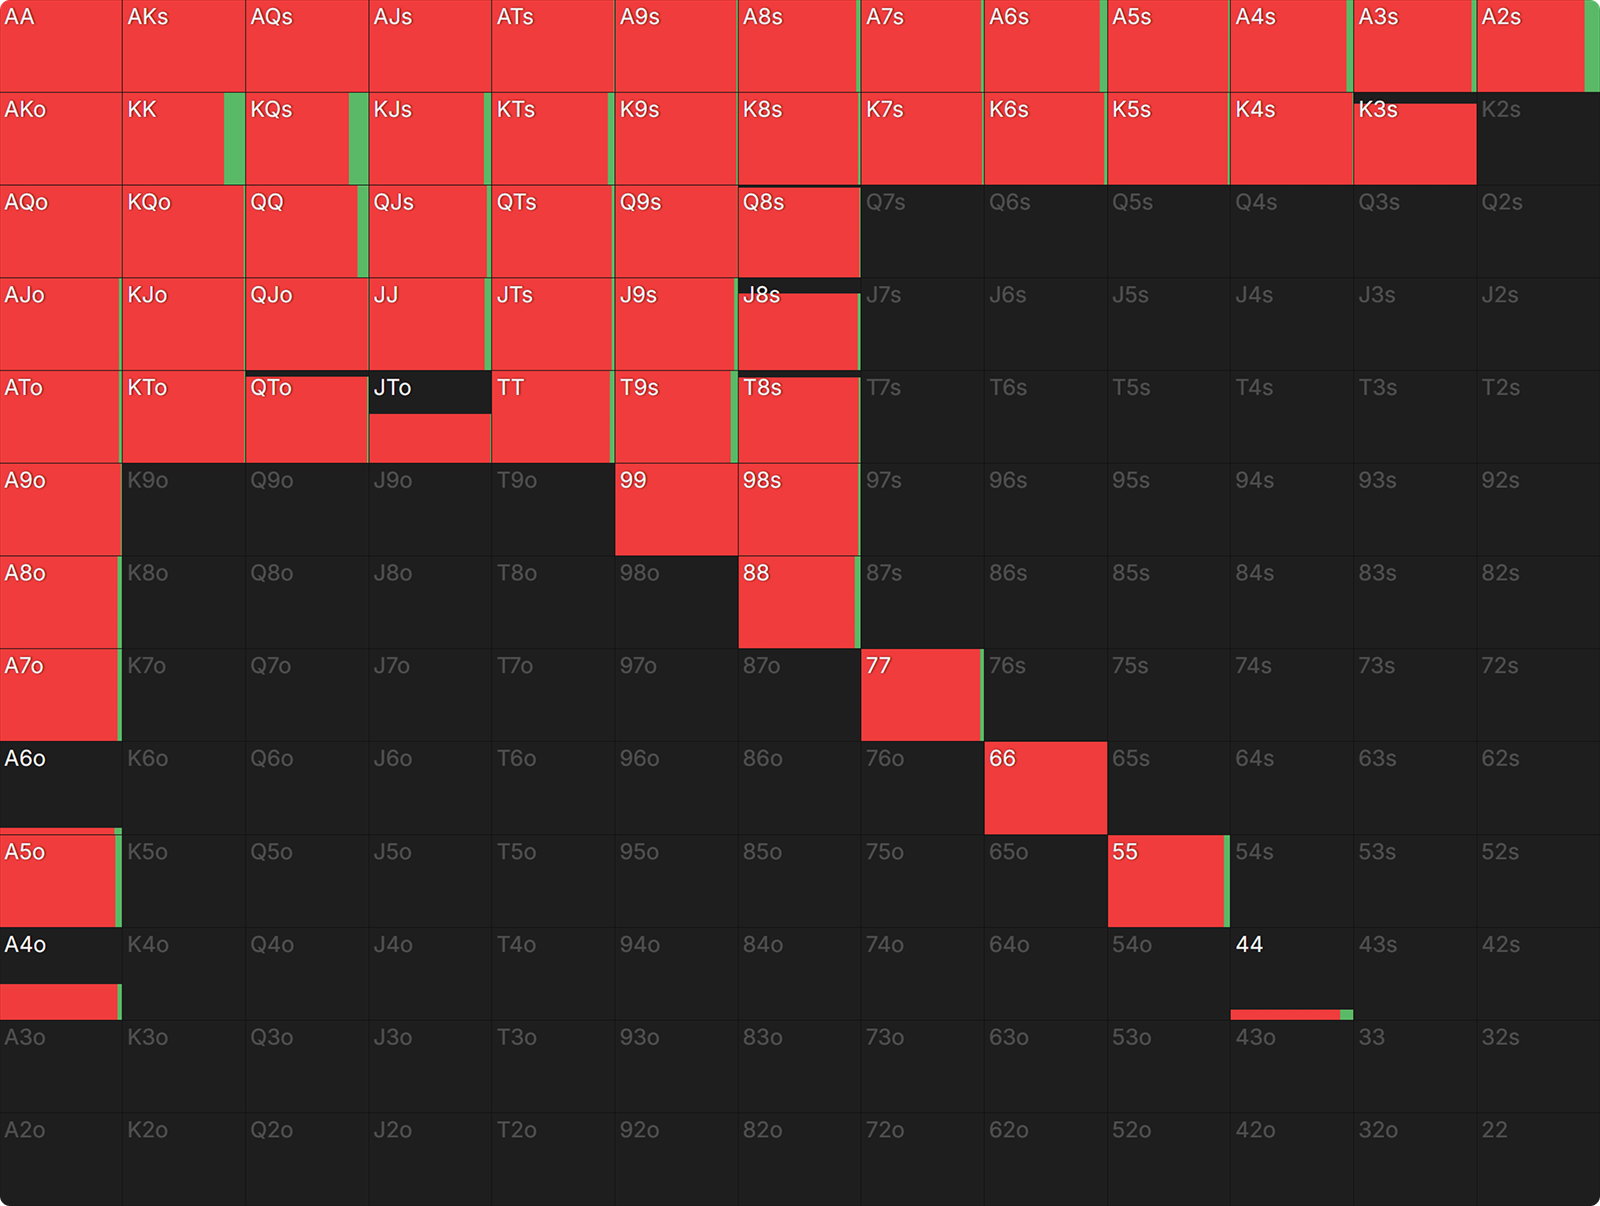
In the next hand, the flop is KJTtt.
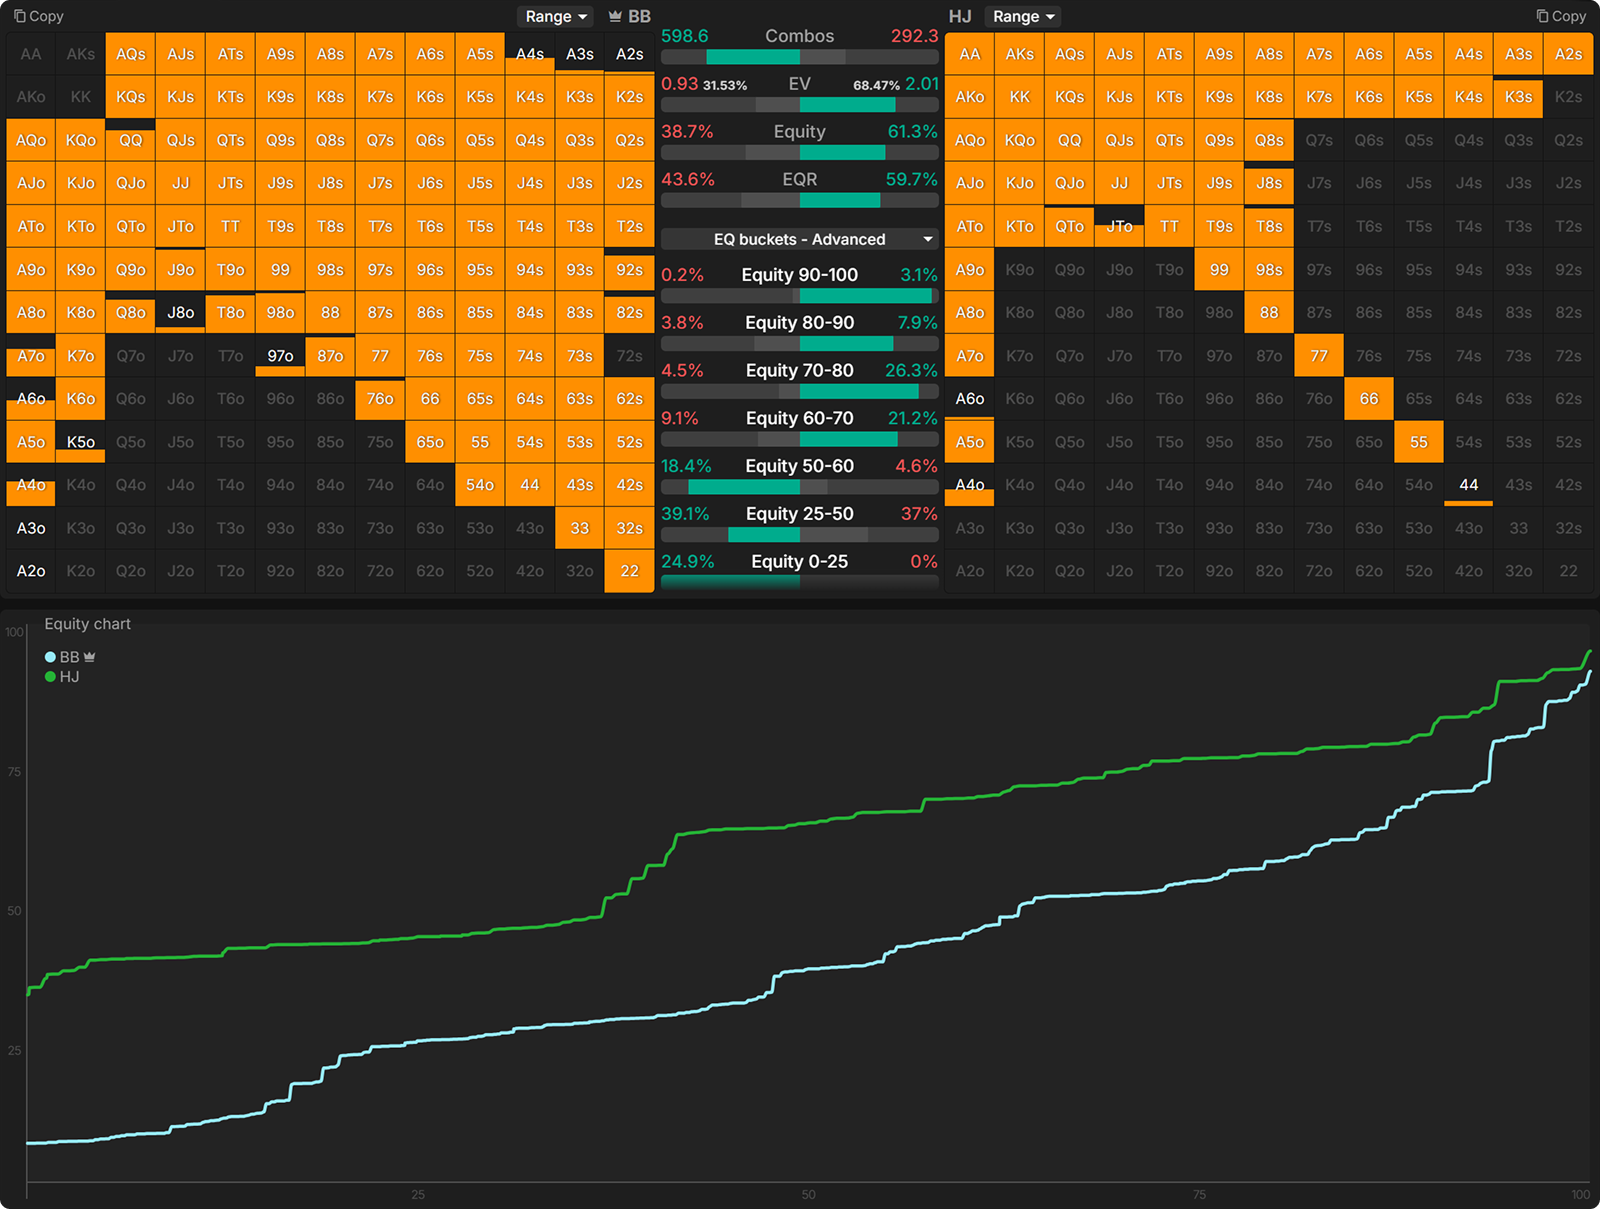
As in the previous example, the HJ boasts a huge range advantage, this time across the board.
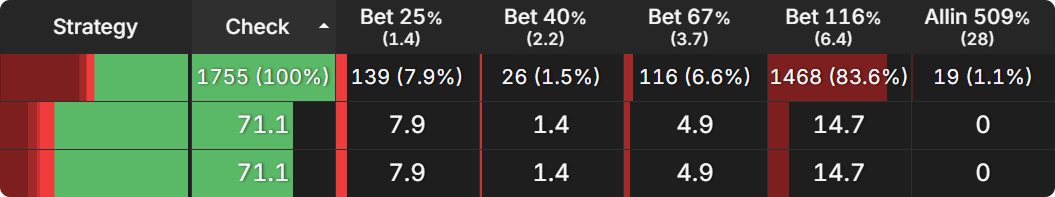
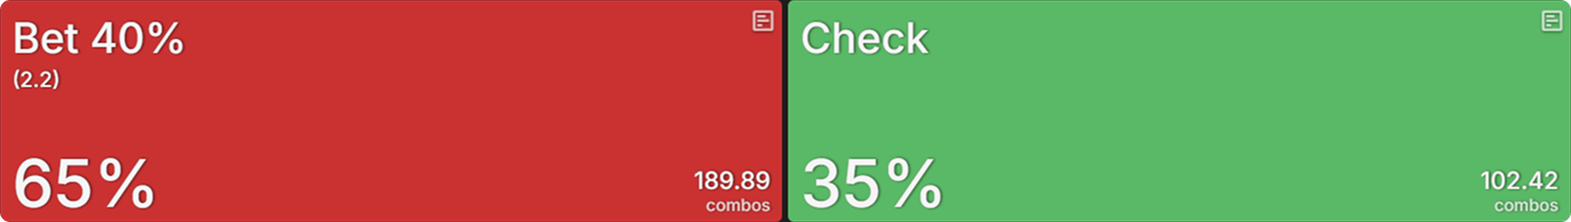
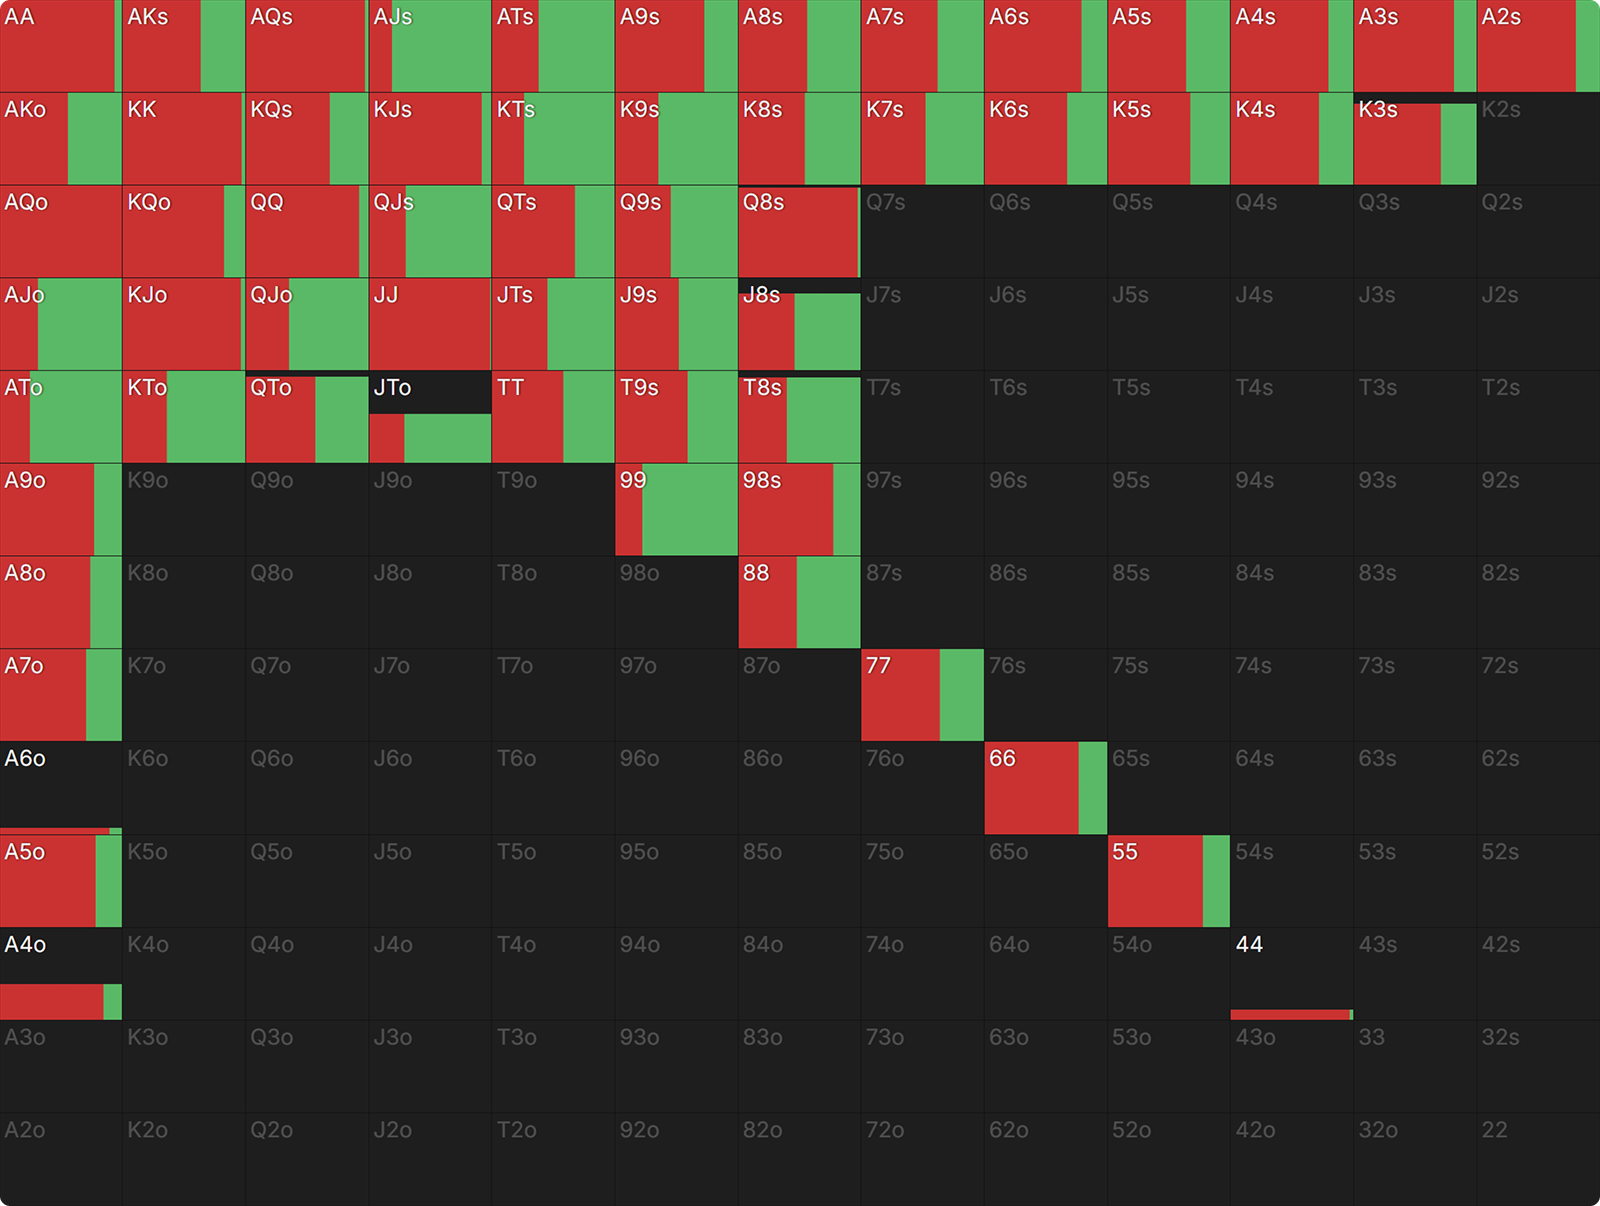
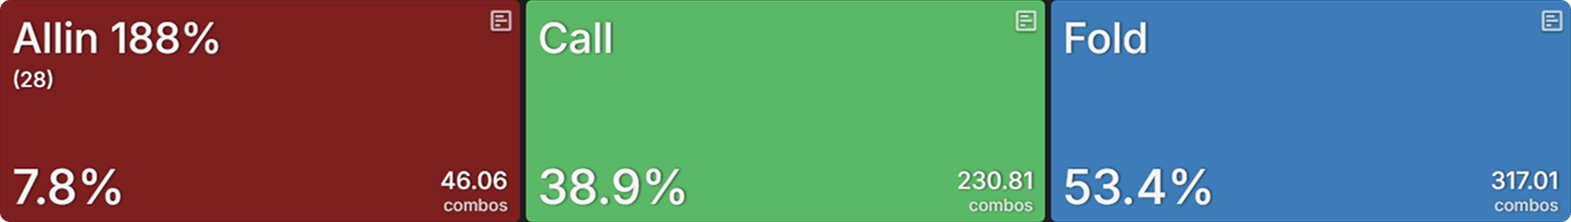
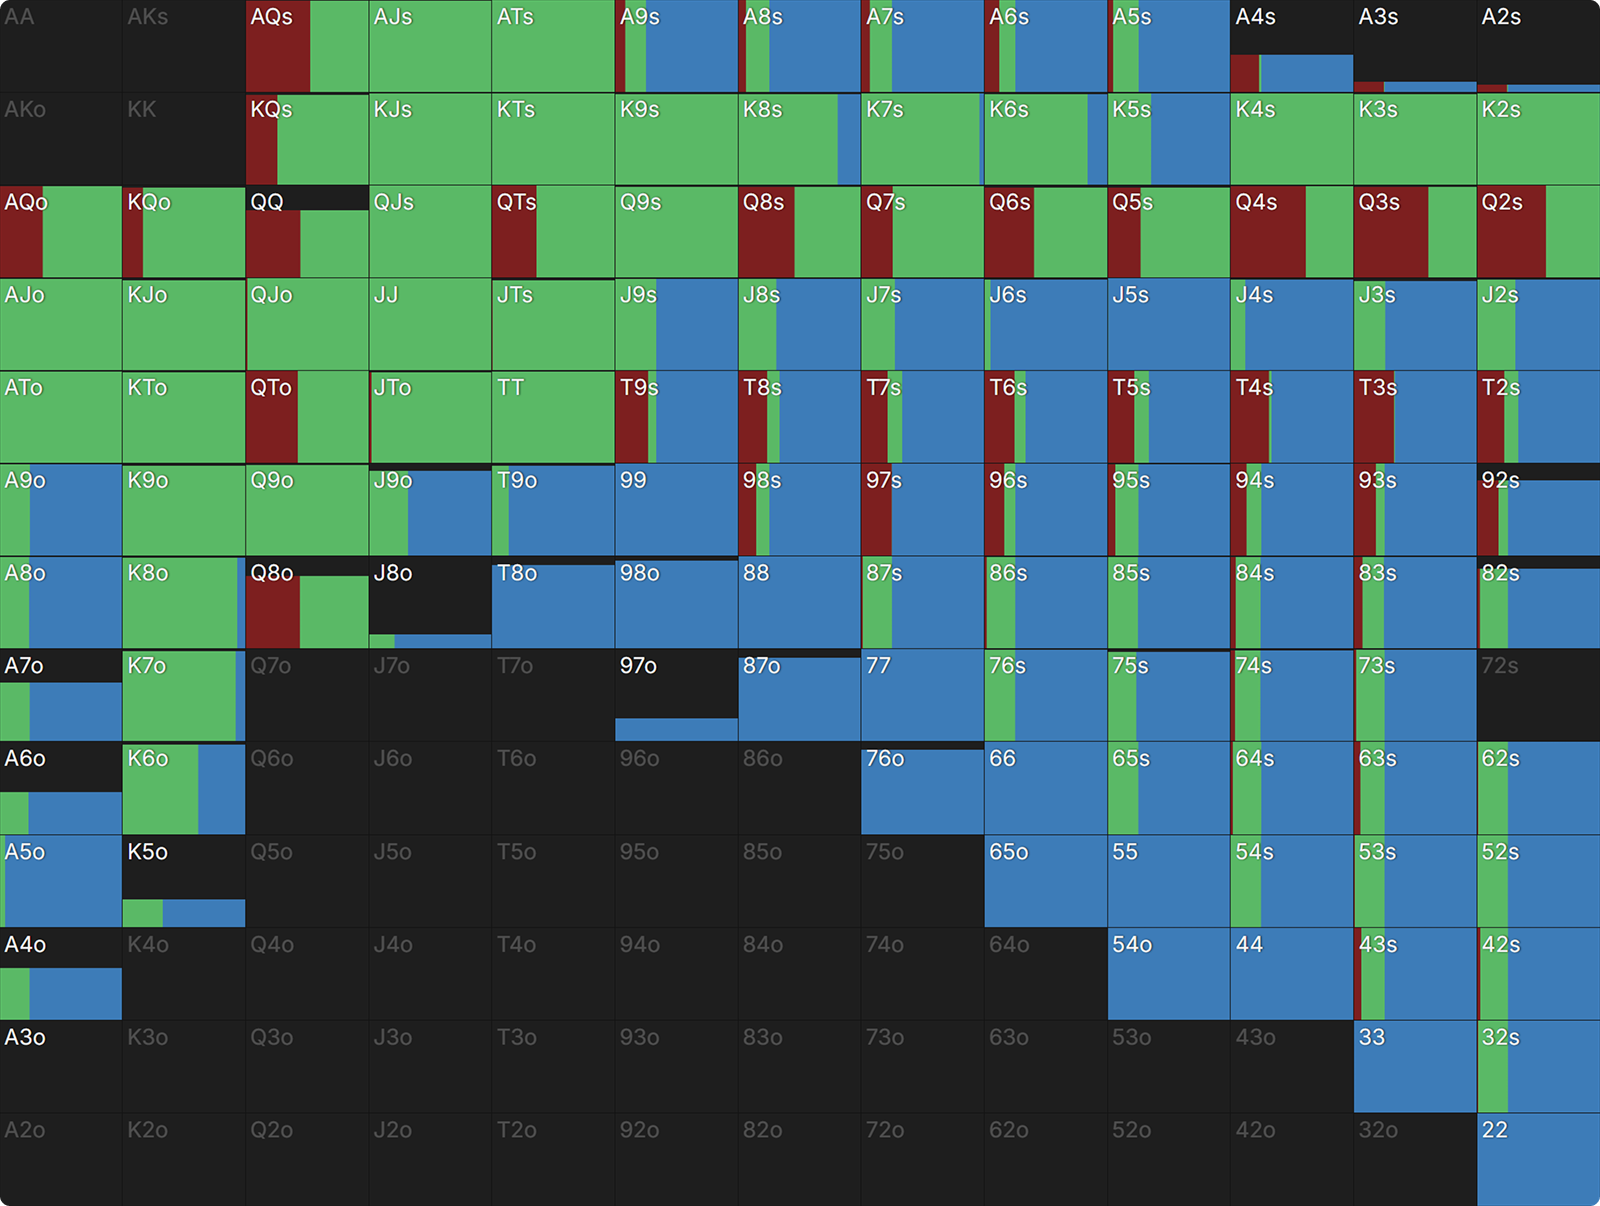
On all three final tables, the BB checks (almost) 100% of the time. Here we have the HJ c-bet strategy per FT:
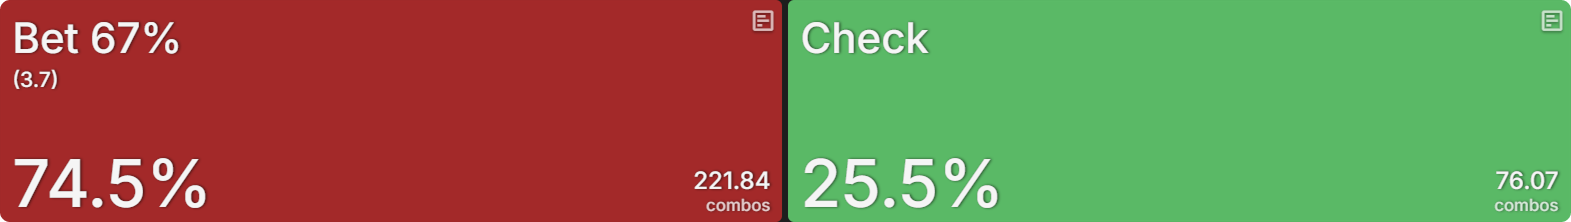
Normal FT
{{grid: 5fr 1fr}}
{{/grid}}
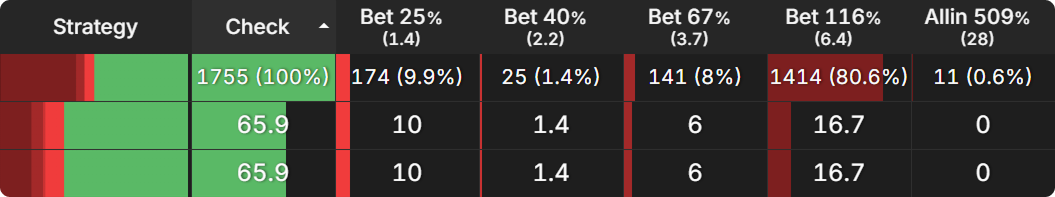
Top-Heavy FT
{{grid: 5fr 1fr}}
{{/grid}}
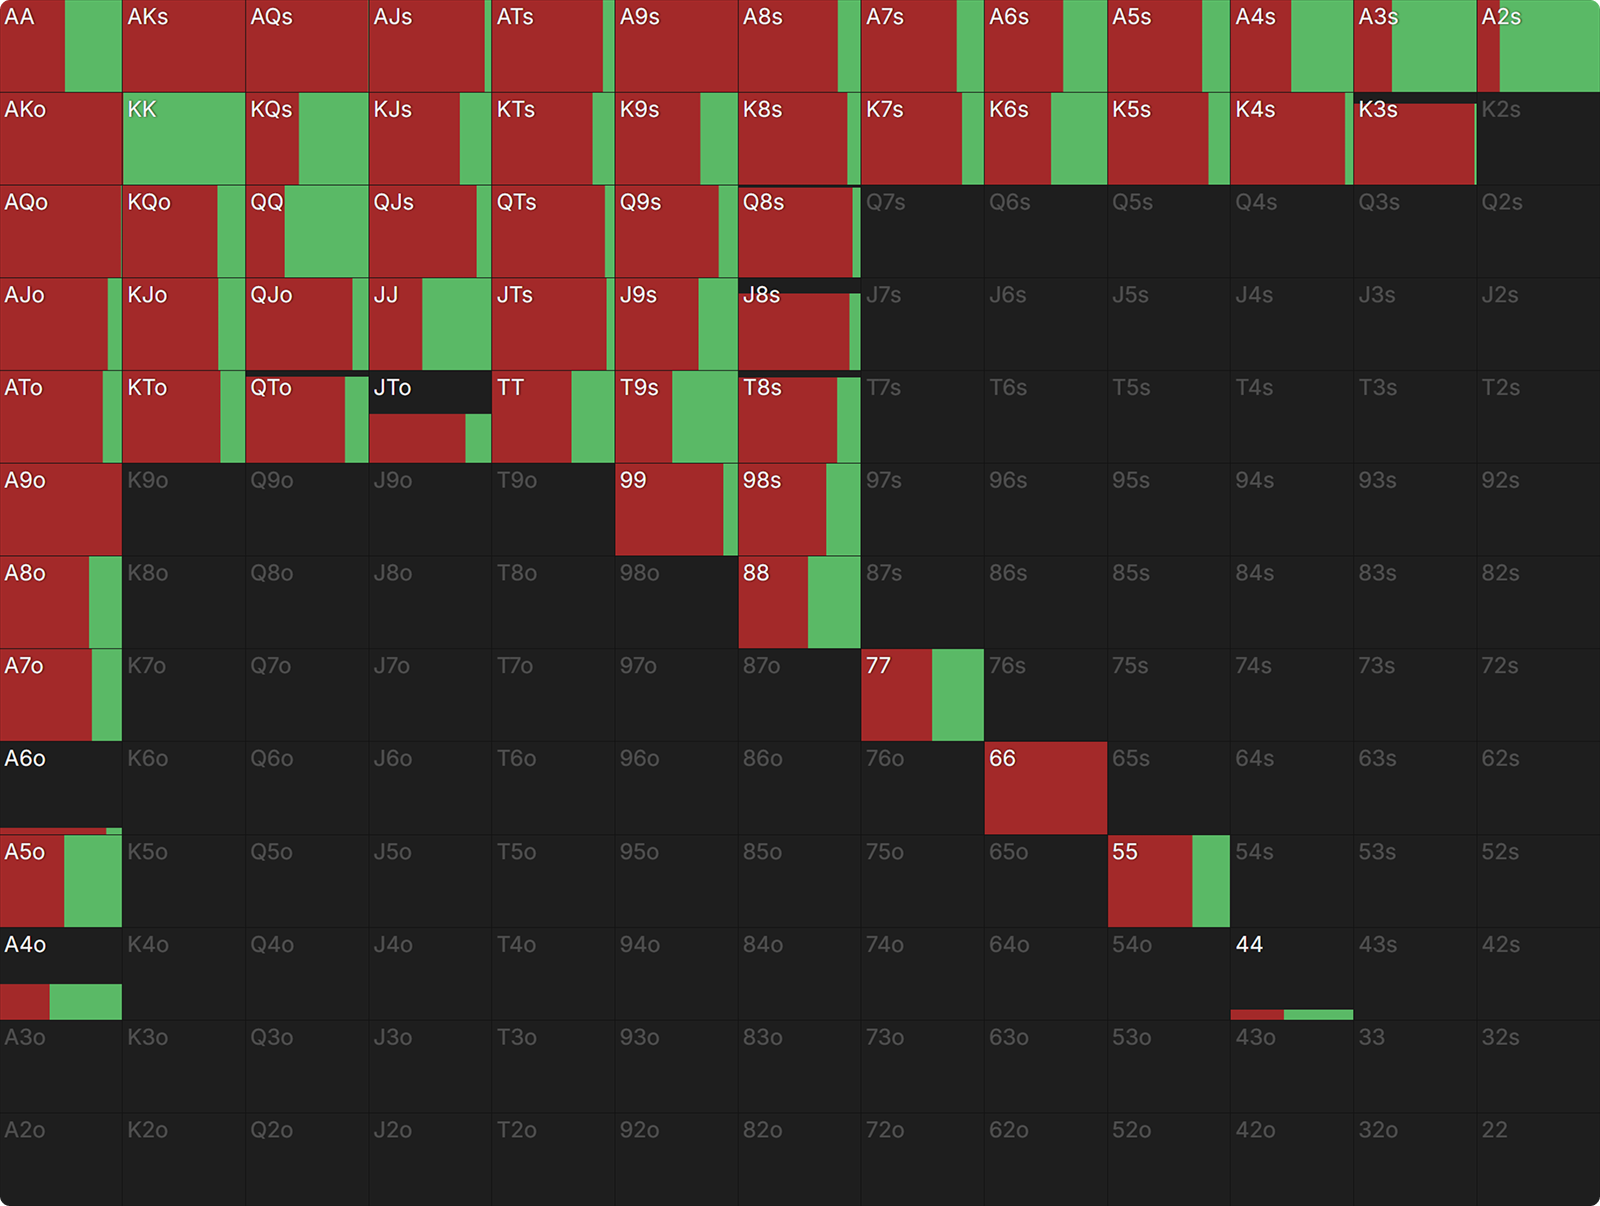
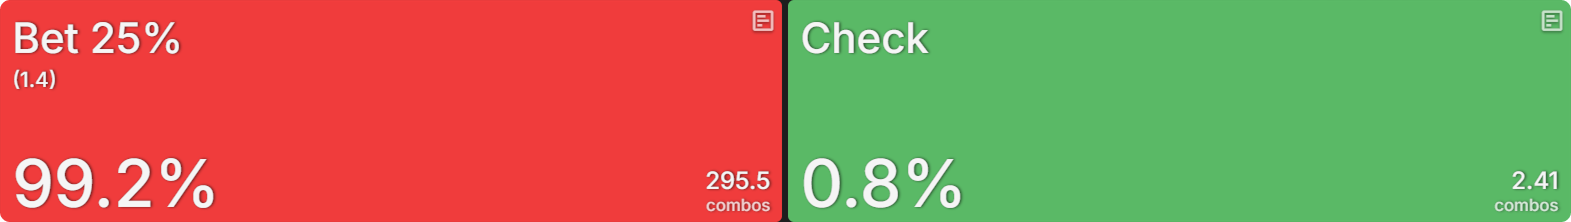
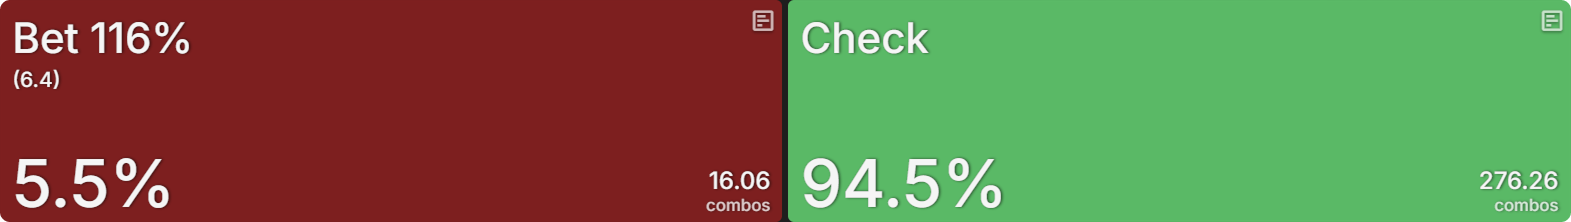
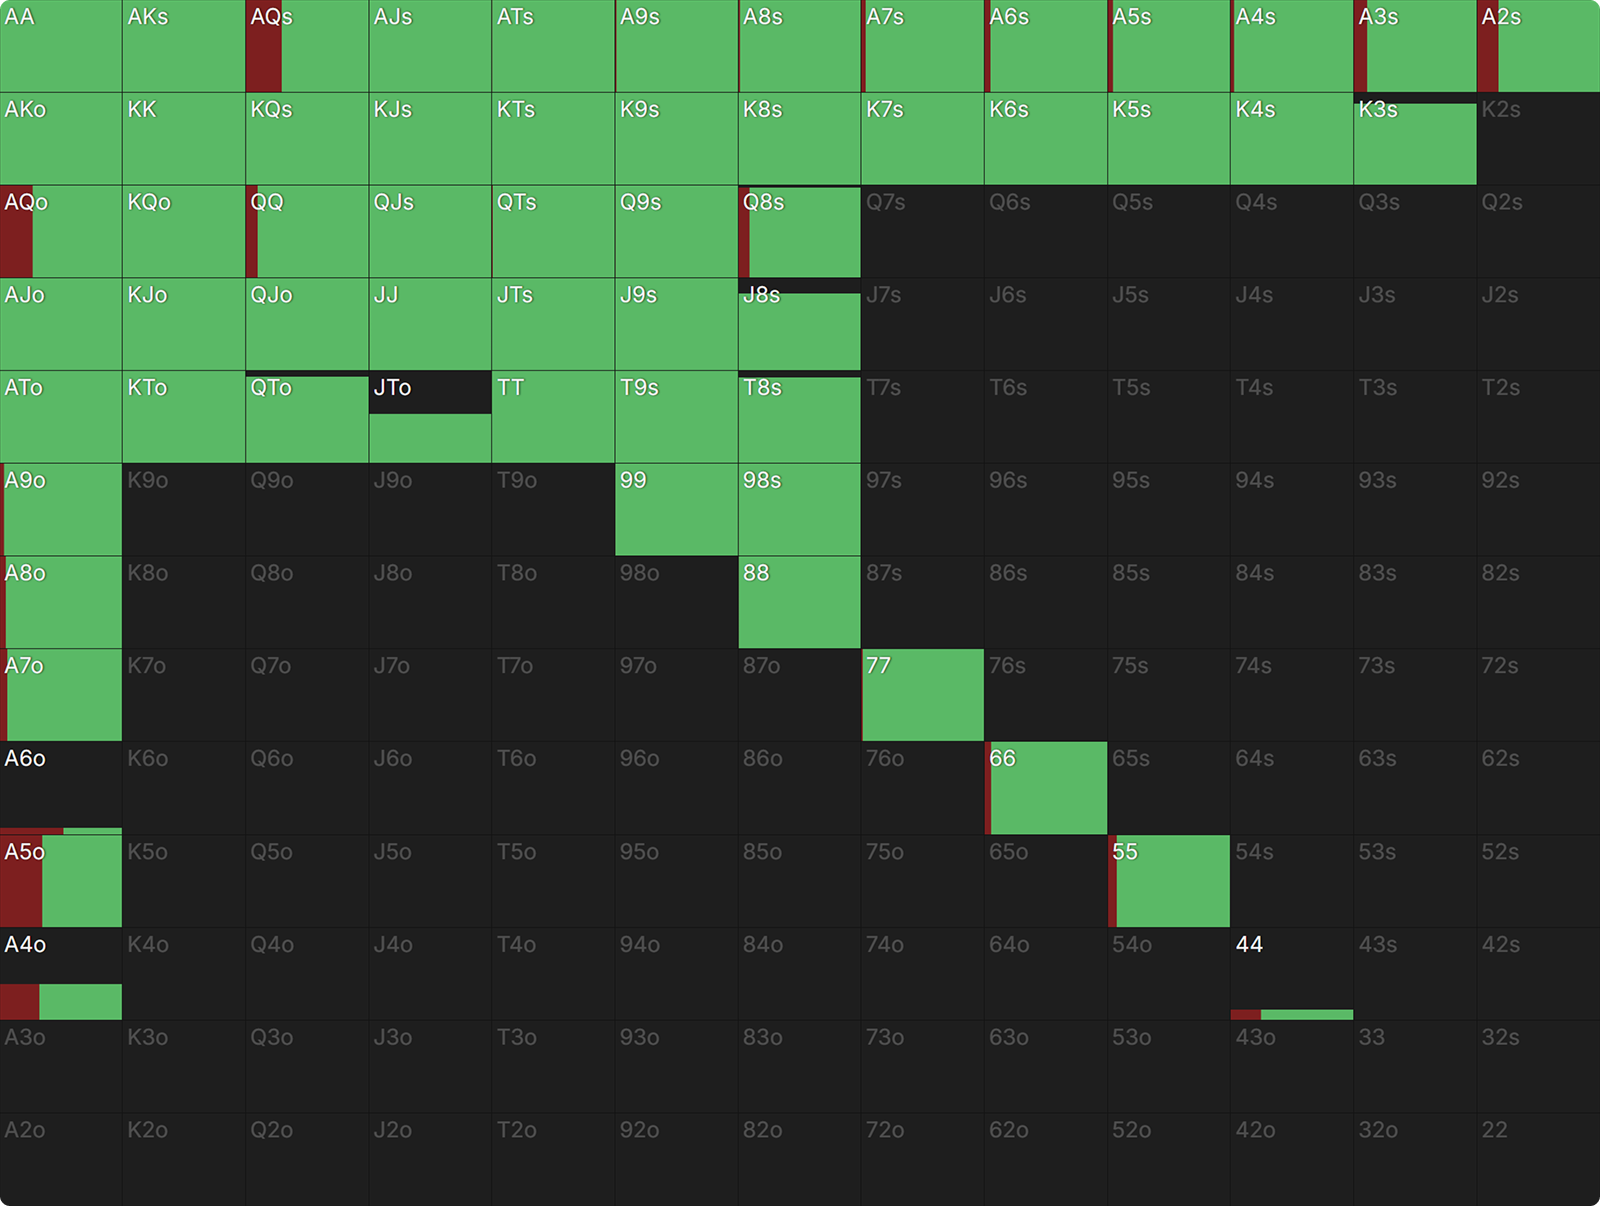
Flat FT
{{grid: 5fr 1fr}}
{{/grid}}
Identical stacks, identical ranges, identical flop, three very different strategies.
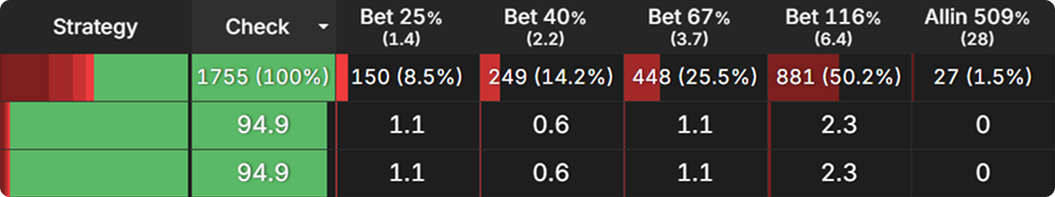
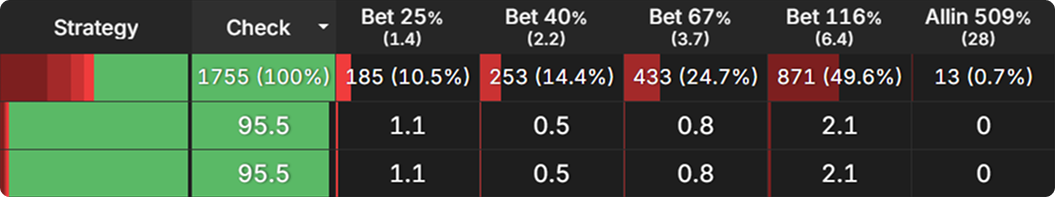
If this were chip EV, it would be a range bet for the HJ. At the top-heavy final table, we still see more betting than checking, but the betting frequency has been dialed down a lot. We still have a risk premium of 11.5% after all, so betting is much riskier.
At the normal final table, we see a polarized strategy of mostly checking and some overbetting. The value threshold has been increased; strong hands like sets and straights overbet, as they still benefit from protection against a lot of hands that can outdraw them.
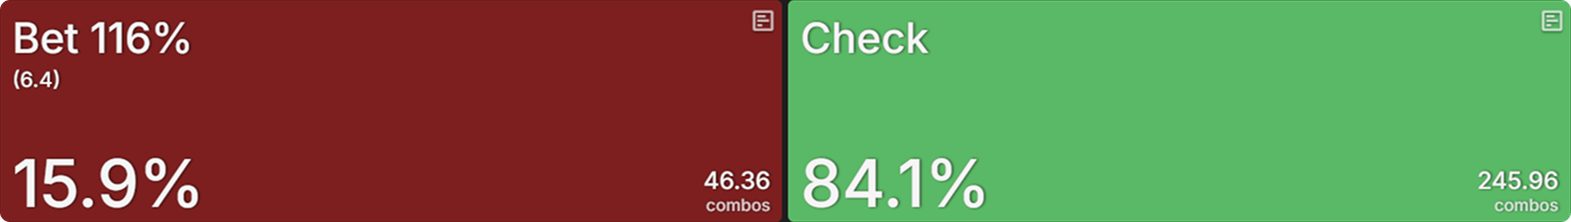
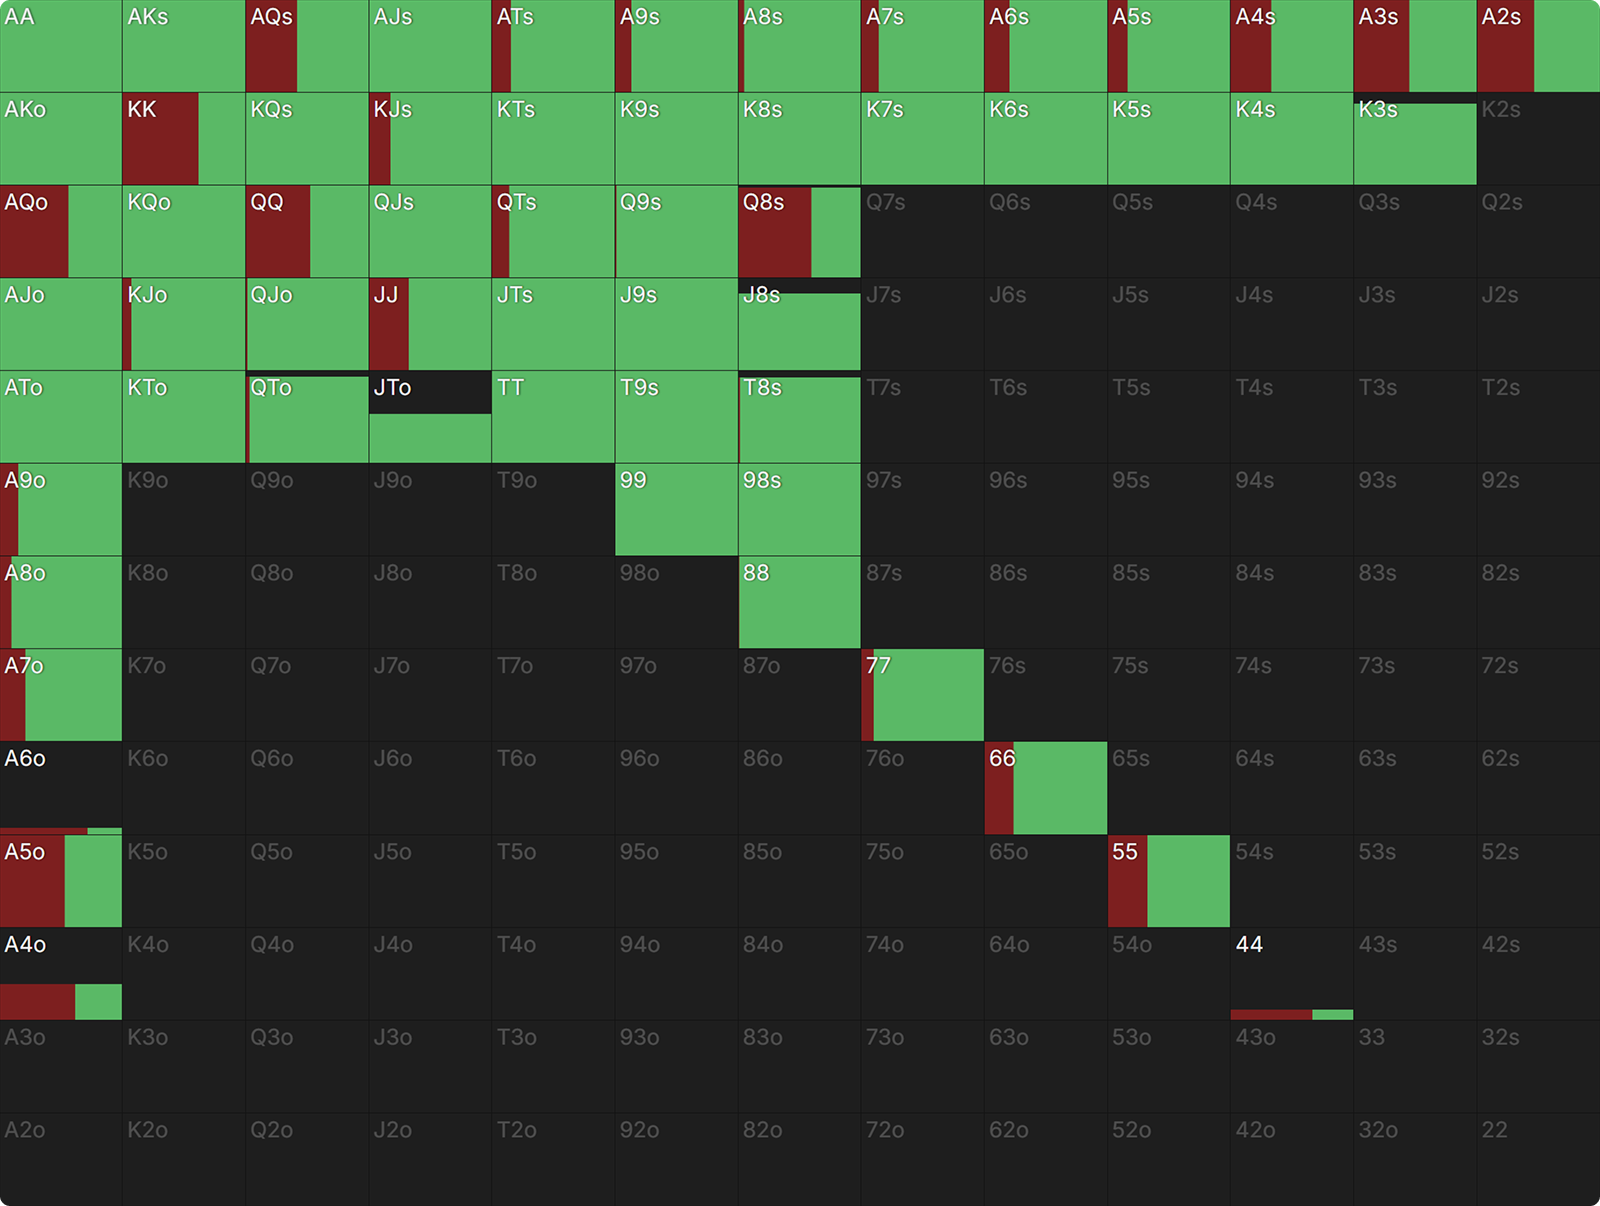
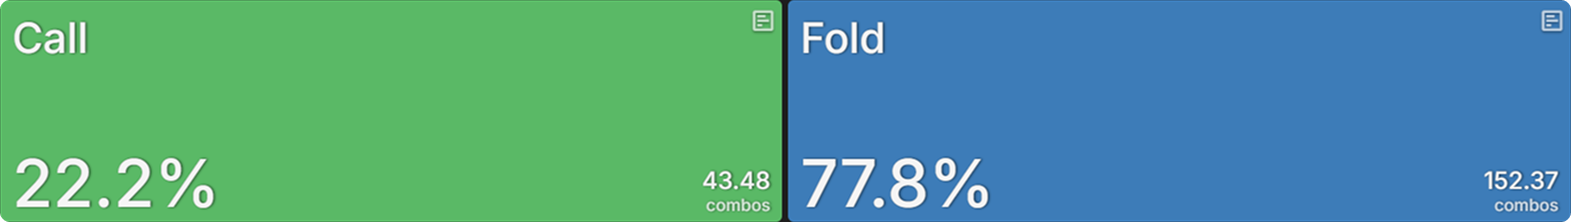
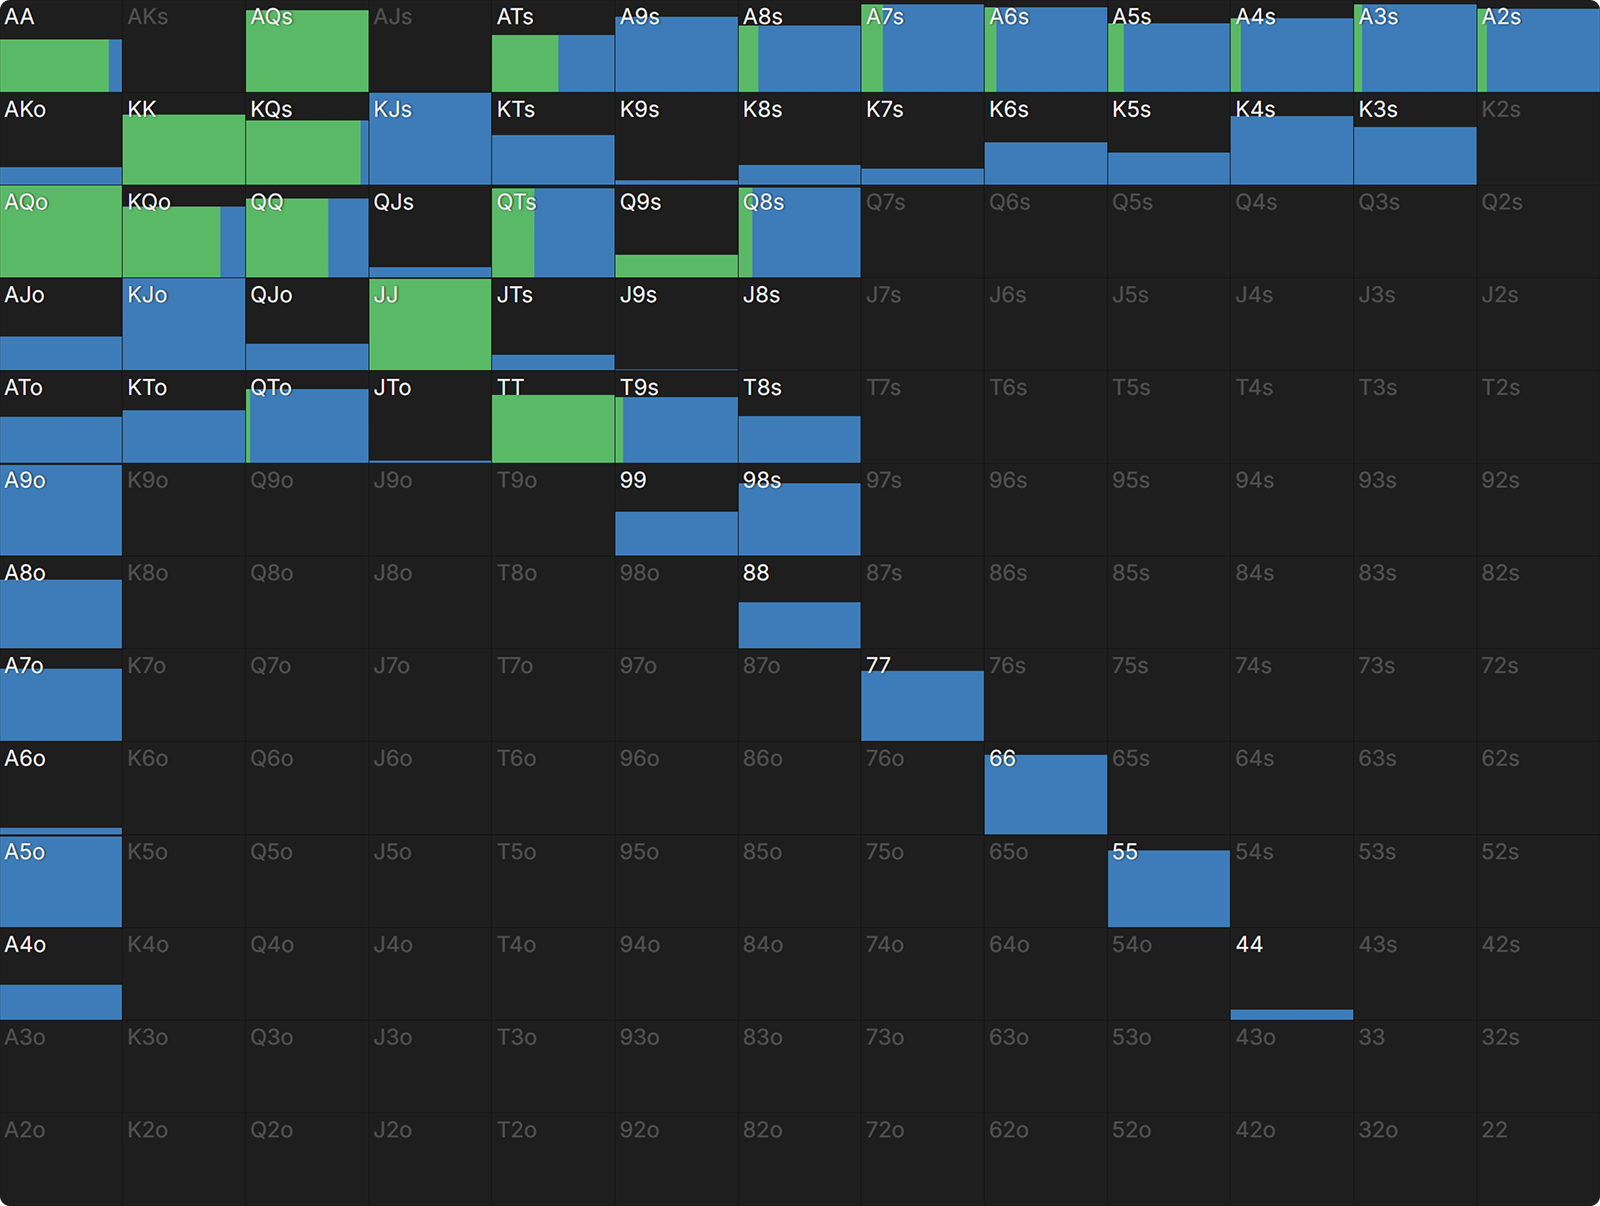
But once we sit at the flat final table, we see the HJ check back ~95% of the time. They have a 61.3% equity advantage and way more nutted hands than the BB, but we still see them check back almost all the time.
My interpretation of this is that because there are already lots of very strong hands out there (straights, sets, two pair), and draws to even stronger hands (flushes, full houses), we would end up playing many very big pots if we bet the flop, which, with our massive risk premium of 17.2%, we’d prefer to avoid.
This is easily testable with a nodelock. I locked the hands so that the HJ used the same strategy as in the top-heavy final table (i.e., betting 40% pot with 65% of their hands).
This is the BB response:
{{grid: 5fr 1fr}}
{{/grid}}
There is a lot of shoving, particularly from Queen-x, which has at least an open-ended straight draw.
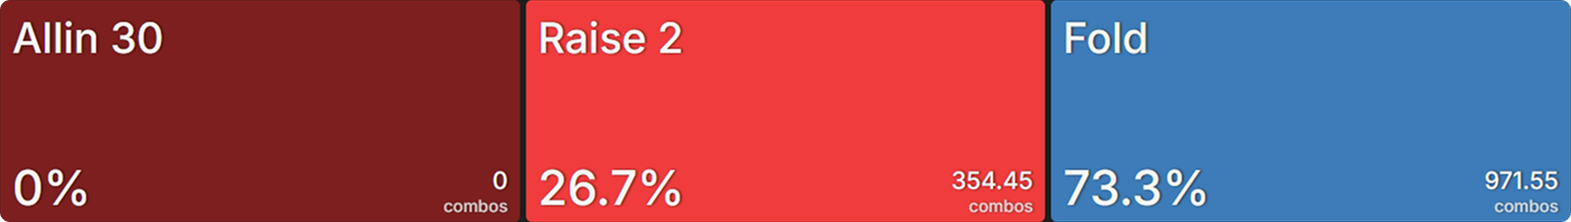
And this is the response to the shove from the HJ:
{{grid: 5fr 1fr}}
{{/grid}}
They are forced to call all-ins with some one-pair hands (like KQ and QT), which is far from ideal. At the same time, they have to fold all the two-pair hands, because once the risk premium is taken into account, those hands do not have enough equity to call.
I have seen strategies like this before, but it was always in satellites where the risk premium is huge. But in practice, the hands usually are preflop shoves anyway. Here, we have perhaps the strongest evidence that very flat payout structures greatly incentivize chip preservation.
Conclusion
I think we have reliably proven that different payout structures yield very different strategies, even when the payout structures don’t look all that different at first glance.
When a payout structure is flat, laddering is more important than playing for the win. Typically, this will lead to checking more hands down and betting larger amounts with strong but vulnerable hands. We really don’t want to bet for thin value and get reraised in these spots.
Most payout structures will fall somewhere between those two data points. If only one thing has become very clear after reading this article, it should be that playing the same “default” final table strategy in games with more extreme payout structures is a big mistake.
When a payout structure is top-heavy, we are much happier to take risks since they come with greater rewards. We don’t mirror Chip EV, but the strategy is a lot closer to it. We ‘play for the win’ as it were.

How ICM Quietly Shapes Postflop Strategy From the Start
How significant is ICM at the start—as in the very first hand—of a tournament? Have we been learning the wrong way all this time by using Chip EV ranges to study spots when stacks are deep and few players have been eliminated?

ICM vs. ChipEV: The Hidden Logic Behind BB 3-Bets
BB 3-betting is fundamentally different from 3-betting from any other seat, even the SB. Calling at a discount and closing the action is such an appealing option that many hands that may seem like “natural” 3-bet candidates have higher EV as calls. This is even more compelling when taking ICM into a
How ICM Reshapes 3-Bet Pots (and Why You Can’t Trust cEV)
Analyzing postflop ICM sims is tricky. Because ICM dramatically changes preflop strategies, starting ranges for postflop spots can be quite different from what they would be in Chip EV sims, making head-to-head comparisons difficult.