Variance and Bankroll Management

Overview
Despite our best efforts to maximize our edge at the tables, at its core, poker is a gambling game. It is beatable, but it is still built around the same foundational pillar as every other casino game: crazy, gut-wrenching, mind-numbing variance!
Watch the Video
{{width: 75%}}
{{/width}}
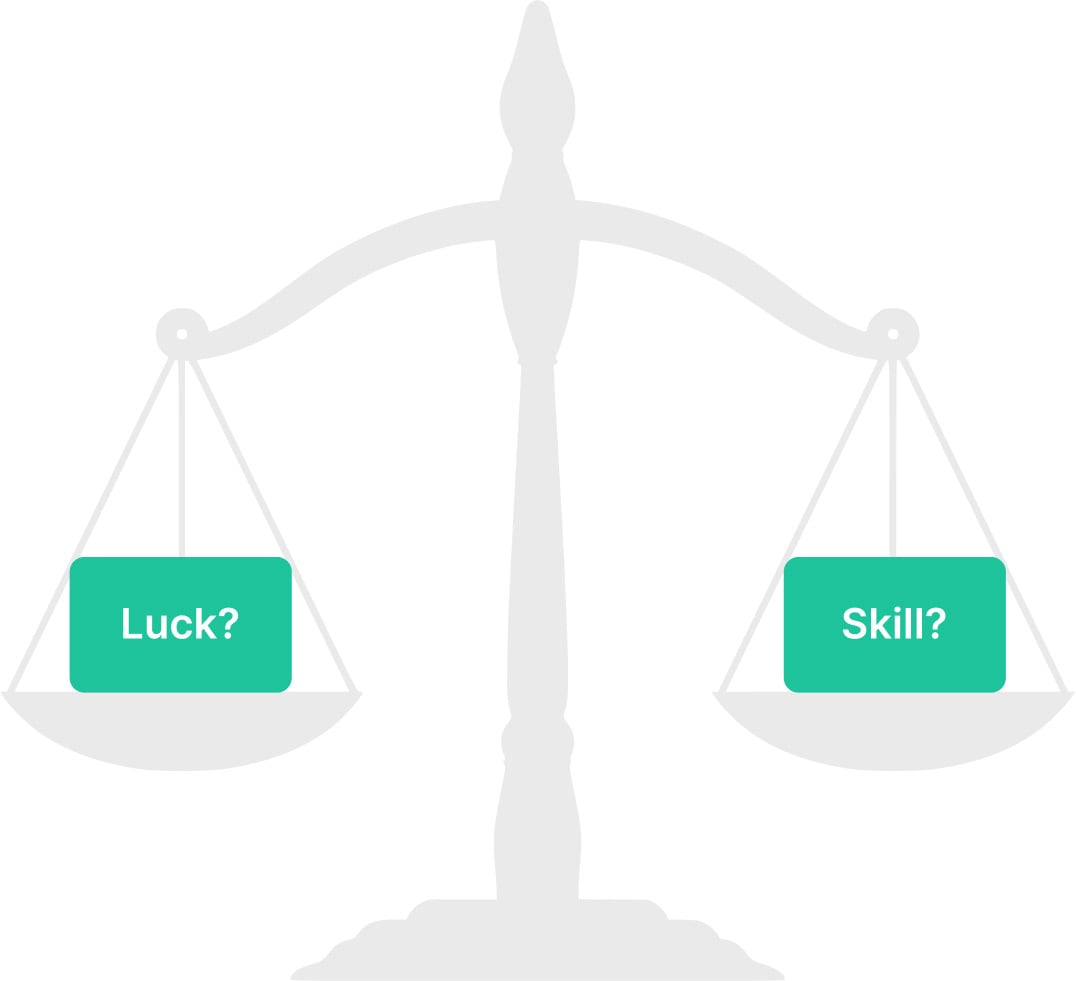
Is Poker Luck🍀or Skill🧠?
{{grid: 2fr 1fr}}
Both! How much luck or skill depends on how many hands you play. Tiny edges get magnified in the long run. In the short run, your results are mostly dictated by luck. But even a small edge exerted over a long enough timeline becomes inevitable. Your results are mostly dominated by luck in the short run, and by skill in the long run!
{{/grid}}
What Exactly Is Variance?
{{grid: 3fr 1fr}}
The term variance refers to a statistical measurement of the spread between numbers in a data set. In poker, variance refers to how “swingy” your results are!
In higher-variance games, a player’s results can deviate further away from their expectation over a given sample.

{{/grid}}
Variance is measured with the “Standard Deviation” metric. You can find this metric in most poker HUDs, but it can also be calculated directly from your results. For cash games, this is measured in BB/100.
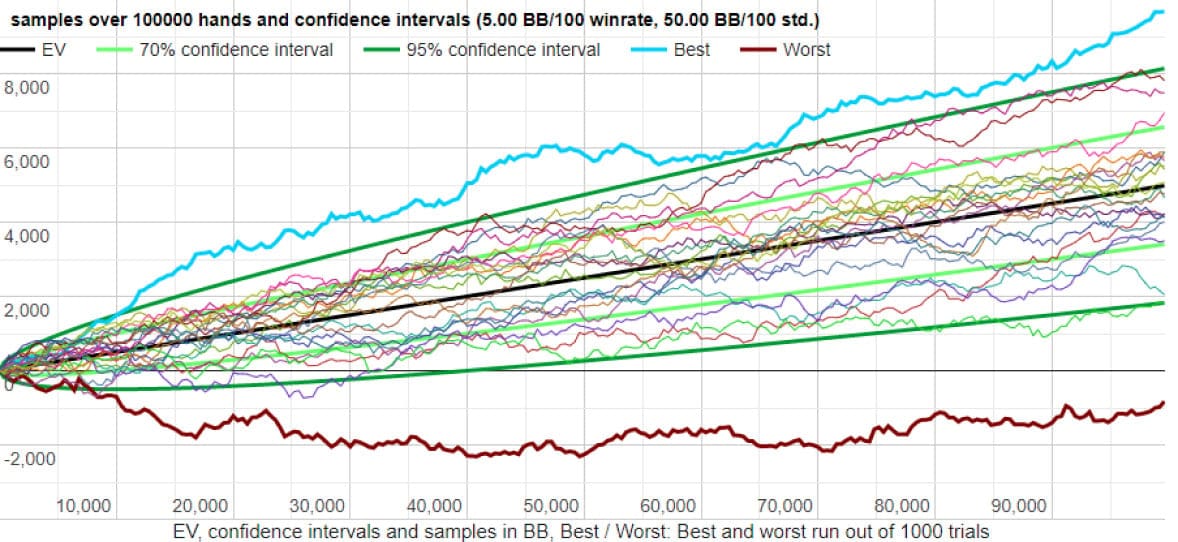
Let’s look at some examples. The following charts are examples of 20 random runs given a set of inputs (credit: Primedope)
Note that the best and worst runs are between {{color: red}}-1,000{{/color}} BB and {{color: blue}}+10,000{{/color}} BB.
Note that the best and worst runs are between {{color: red}}-17,000{{/color}} and {{color: blue}}+22,000{{/color}}!
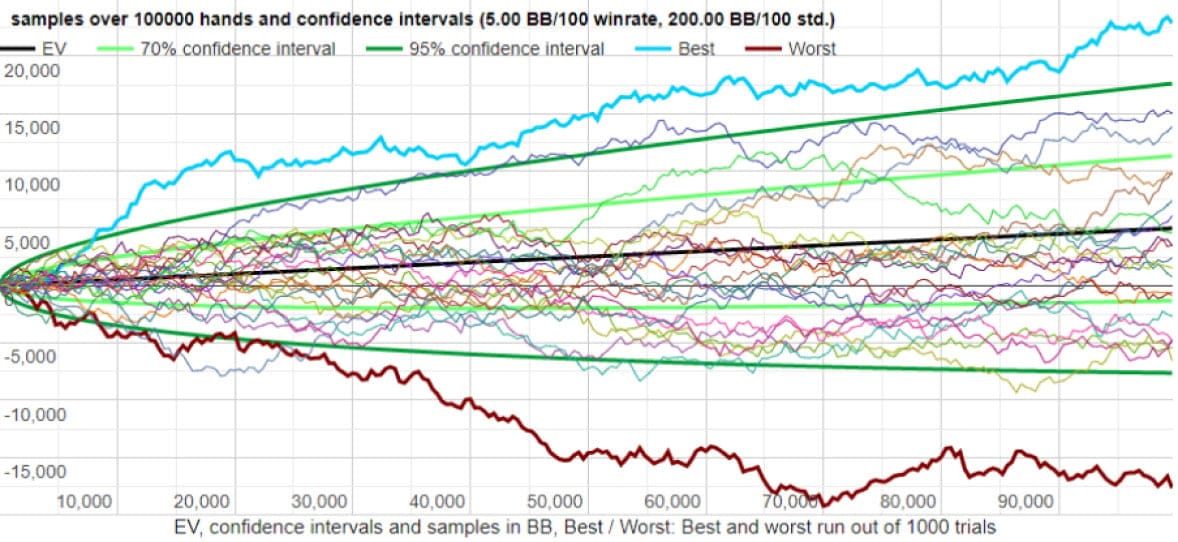
Both players have an identical win rate, but the higher-variance player has a much larger spread between their best and worst runs!
The Law of Large Numbers
{{grid: 4fr 1fr}}
The gambler’s fallacy is very common among poker players. Let’s say we flip a fair coin, and it lands on heads 6 times in a row. What is the probability that it lands on heads the next flip?
If you’re superstitious, you might think you are “owed” tails. But that’s simply not how reality works. The next flip is 50%/50%. You’re just as likely to flip a 7th heads as you were to flip heads the first time.

{{/grid}}
After thousands of flips, we would expect heads and tails to even out. But that’s not because of some universal Karma; it’s simply the law of large numbers. Imagine we flip 1000 times and heads retains the 6-flip lead. At this point, we’ve flipped 503 heads and 497 tails—this is actually the expected value when starting with a 6-point lead. At this point, it’s 50.3% heads, 49.7% tails.
Now imagine we flip 100,000 times and retain the same 6-point lead. Now it’s 50.0003% heads and 49.9997% tails. The “luck” appears to even out despite tails never catching up. This is the law of large numbers.
Similarly, just because you’ve had bad luck doesn’t mean you are “owed” any rungood. The deck owes you nothing. Each hand is an independent event without memory of how you got your Aces cracked.
The opposite is also true. Just because you’ve run well doesn’t mean you’re owed any bad luck. The truth is that variance in poker is far beyond what humans are capable of truly conceptualizing. If you’ve ever played around with a poker variance calculator, you’d find that it takes tens of thousands of hands before you can see a statistically significant edge materialize.
Confidence Intervals
One of the most common questions we see is “how many hands do I need before I can be sure of my win rate?”. The problem with this question is that it doesn’t have a real answer. In math, we use confidence intervals to address these unknowns!
Confidence intervals follow the 68-95-99 rule:
- 68% of the time your results will fall within 1 standard deviation σ of the mean
- 95% of the population is within 2 standard deviations (2σ) of the mean
- 99.7% of the population is within 3 standard deviations (3σ) of the mean
{{center}}Distribution of Variance{{/center}}
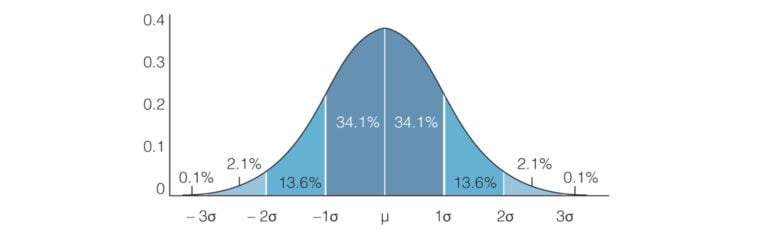
{{size: 17px}}-1σ to 1σ = 1 Standard Deviation (i.e., ~2/3 of the time, your results will fall within this range){{/size}}
{{size: 17px}}-2σ to 2σ = 2 Standard Deviation (i.e., 95% of the time, your results will fall within this range){{/size}}
{{size: 17px}}-3σ to 3σ = 3 Std Dev (i.e., 99.7% of the time, your results will fall within this range){{/size}}
Let’s look at an example:
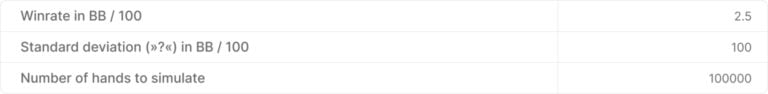
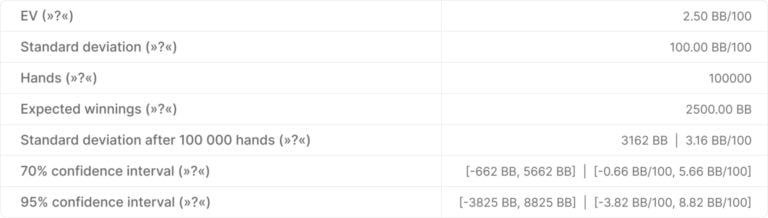
Let’s assume your “true” (mean) win rate is 2.5 BB/100. This is your expected value. Your standard deviation (σ) after 100k hands is 3.16 BB/100.
A better way to write your win rate would be:
{{center}}2.5 ± 3.16 BB/100. (Winrate ± σ){{/center}}
In other words:
- 70% of the time (~1σ) your results will fall between -0.66 BB/100 and 5.66 BB/100
- 95% of the time (2σ) your results will fall between -3.82 and 8.82 BB/100
In science, unknown variables are assigned margins of error and confidence intervals rather than exact numbers. Your win rate is an unknown variable. Therefore, it’s impossible to assign an exact number. The best you can do is assign some margin of error.
The formula for your margin of error is a function of your standard deviation and volume. Putting in more volume, or lowering your variance, will lower the margin of error and increase the confidence of your results. The formula is as follows:
{{width: 90%}}

{{/width}}
Where σ is your standard deviation in BB/100, and hands is simply the number of hands you’ve played. For example, above we see a standard deviation of 100 BB/100, and 100k hands played. 100 * (100,000/100)^0.5 = 3162. In other words, the results are plus or minus 3162 BB, or 3.16 BB/100. This is shown as “standard deviation after 100000 hands” in the above picture, but it’s easier to think of this as a margin of error.
Managing Risk
Variance can be calculated by free computer programs based on the aforementioned inputs.
Some recommended websites for this purpose are Primedope and ReviewPokerRooms. Understanding the bounds of variance is a great way to put your results and expectations in context. Spending some time playing around with different inputs yourself and seeing the resulting outputs is invaluable.
The above tools are for cash games.
Tournament players tend to experience even greater variance. Try this MTT Variance calculator!
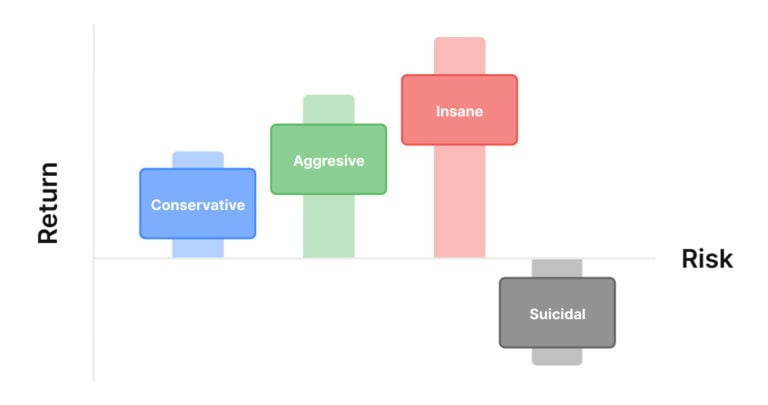
Bankroll Management Guidelines
The purpose of this article is to give you the tools to build your own bankroll management strategies, rather than prescribing some answer. Your BRM is a function of your risk profile. However, we’ve outlined some very basic BRM guidelines below based on common wisdom:
{{grid: 6fr 1fr}}
For cash players: 35 to 65 buy-ins
→ Never risk more than 5% of your roll
For tournament players: 75 to 125 buy-ins
→ Never risk more than 2% of your roll
{{/grid}}
Kelly Criterion
The Kelly Criterion tells you what portion of your bankroll you should risk. It considers your edge and odds on a bet and outputs how much of your bankroll you should risk.
{{width: 80%}}
{{/width}}
The formula for the Kelly Criterion is outlined as follows:
{{grid: 2}}
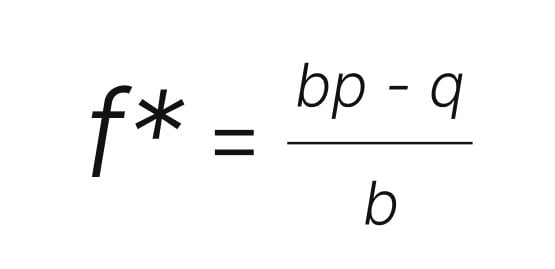
b = the decimal odds – 1
p = the probability of winning
q = the probability of losing (= 1 – p)
{{/grid}}
Let’s try an example:
- You play HU SnG and average a 5% return on investment (ROI).
- Your bankroll is $1000.
{{question-mark}}
What stakes should you play to grow your bankroll as fast as possible?
{{/question-mark}}
{{grid: 5fr 1fr}}
A) $100 buy-in
B) $50 buy-in
C) $25 buy-in
D) $10 buy-in

{{/grid}}
{{toggle: Reveal Answer}}
B) $50 buy-in.
The basic premise of the Kelly Criterion is that you should risk your edge! For a simple 1:1 wager, if you have a 5% edge, you should risk 5% of your bankroll, which comes to $50 in this example.
Here’s how to solve this with math:
{{grid: 1fr 2fr}}
p = 52.5%
q = 47.5%
f* = p – q = ROI
f* = 5%
5% of $1000 = $50
This is based on a “Full Kelly” strategy. A full-kelly strategy is like redlining your engine♨️! In practice, it’s often better to implement half-kelly or even quarter-kelly strategies. A half-kelly strategy captures 75% of the growth while only taking on 25% of the variance. So C) $25 buy-in might be a better answer in practice.
{{/grid}}
{{/toggle}}
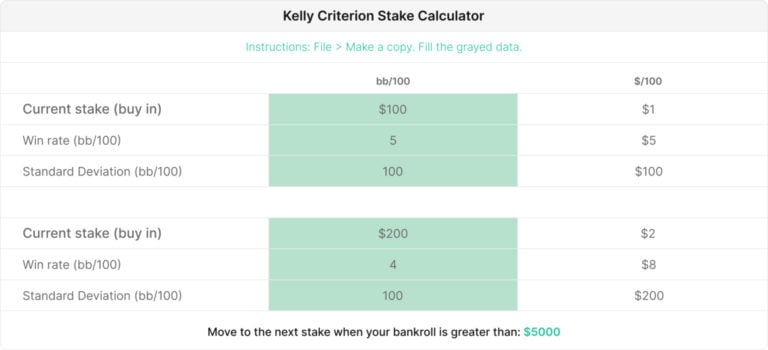
Optimal Bankroll Management Strategies
The Kelly Criterion tells you what portion of your bankroll you should risk. How much you should risk depends on your win rate and variance. Just remember that Kelly is the boundary, not the goal! You should invest less than Kelly in practice.
We can use math to translate a poker win rate in cash games or other formats to optimal BRM strategies. We’ve built a handy BRM optimization tool to help you move up faster🚀
This calculator finds the minimum bankroll required to justify moving up stakes and taking on more variance in exchange for a higher hourly win rate.
{{grid: 3fr 1fr}}
We’ve also included a (beta) calculator for MTT players! Kelly becomes more complicated for bets with multiple outcomes (tournament placements). Some outcomes result in huge changes to your bankroll, while others are quite small.
{{/grid}}
Maximize this equation to find the optimal BRM strategy in MTTs:

Where:
- 'Probability' represents the probability of each placement in the tournament.
- 'Outcome' represents the fractional change of your bankroll for some placement in the tournament. For example, if placing first would increase your bankroll by 20%, then that outcome is assigned a value of 1.2. If busting decreases your roll by 1%, that outcome is assigned a value of 0.99.
- Add a term for every possible outcome in the event.
In practice, it’s quite difficult to assign values to this equation, but we can estimate the probabilities given some edge (ROI).
{{exclamation-mark}}
Note that the 100BI rule is far too aggressive for most large-field MTT’s!
{{/exclamation-mark}}
Tilt
Tilt is defined as taking a suboptimal action due to emotional distress rather than a rational justification. Many poker players succumb to tilt when on a downswing due to fear of losing more money or a desire to win back previous losses.
Tilt can be very dangerous since, as demonstrated above, decreasing your win rate will result in greater variance. This becomes a self-fulfilling prophecy and further extends the duration of downswings.
We’ve discussed more about tilt management in this article.
Conclusion
If there is one thing to take away from studying poker variance, it is that the old adage “don’t gamble with money you can’t afford to lose” holds true.
We hope that as you learn more about variance, it will help you gain a better understanding of the temporariness of upswings and downswings and improve your mental state as you advance in your poker journey.
How to Use Range Builder in GTO Wizard To Improve Your Game
In this article, we will look at another key feature: “Range Builder.” The Range Builder has you construct your entire strategy for any (preflop or postflop) spot. Your strategy will be graded based on how well it matches the GTO solution. This tool forces you to think globally about how you approac

Top GTO Wizard Features the Pros Prioritize (and What They Leave Out)
In this roundtable series, I have been asking GTO Wizard content creators about some of the software’s best and most surprising features. In an attempt to see what world-class coaches prioritise and to find hidden gems that provide us with more bang for our buck when we study.

How to Prep Like a Pro for WSOP
The World Series of Poker (WSOP) is one of the most recognized tournament series in the world, with even those unfamiliar with poker knowing the brand itself. Each year, tens of thousands of players come for events throughout the series, some attracting 20,000 or more participants.