Visualizing Implied Odds

Overview
Implied odds are a key metric when it comes to poker theory. You may have heard the term, and developed a baseline understanding of the idea, however, the concept has evolved a lot in the solver era.
What Are Implied Odds?
Implied odds are the value you expect to gain over and above your raw equity. You can think of it as the value you expect to gain on future streets when you outdraw your opponent. This concept is used in contrast to “direct pot odds” as a way to explain why some hands can profitably draw despite not having enough raw equity to call.
Direct vs. Implied Odds
Here’s an example.
{{question-mark}}
We’re facing a 10bb pot-sized bet on the turn. We hold a draw with 25% equity.
Should we call?
{{/question-mark}}
Direct Pot Odds Calculation
Direct pot odds refer to the percentage of the time you need to win in order to at least break even on a call. This assumes no money goes in later.
- 25% of the time we hit our draw and win 20bb (the pot + opponent’s bet)
- 75% of the time we miss and lose 10bb (our call)
EV of calling = (25% × 20bb) – (75% × 10bb) = 5 – 7.5 = -2.5bb
Clearly, this is a losing call. The problem with this calculation, however, is that it ignores money that goes into the pot later—that’s where implied odds come in!
Implied Odds Calculation
In order to justify this call, we need to win some extra money (M) on the river. We can always fold if we miss.
- 25% of the time we hit our draw and win 20bb + M (the pot + opponent’s bet + M)
- 75% of the time we miss and lose 10bb (our call)
EV of calling = (25% × (20+M)) – (75% × 10)
{{question-mark}}
How much extra do we need to win when we hit that draw in order to break even?
{{/question-mark}}
Set EV to zero to find the break-even point, then solve for M:
0 = (25% × (20+M)) – (75% × 10)
M = 10
We need to win 10bb more on the river, on average, to justify calling. That amounts to a mere ⅓ pot bet on the river. So if we think we can extract at least a ⅓ pot bet when we hit our draw, then this call becomes profitable!
In other words, a call “implies” that it would win (at least) an extra 10bb on the river. This is where the term gets its name.
How It Relates to Equity Realization
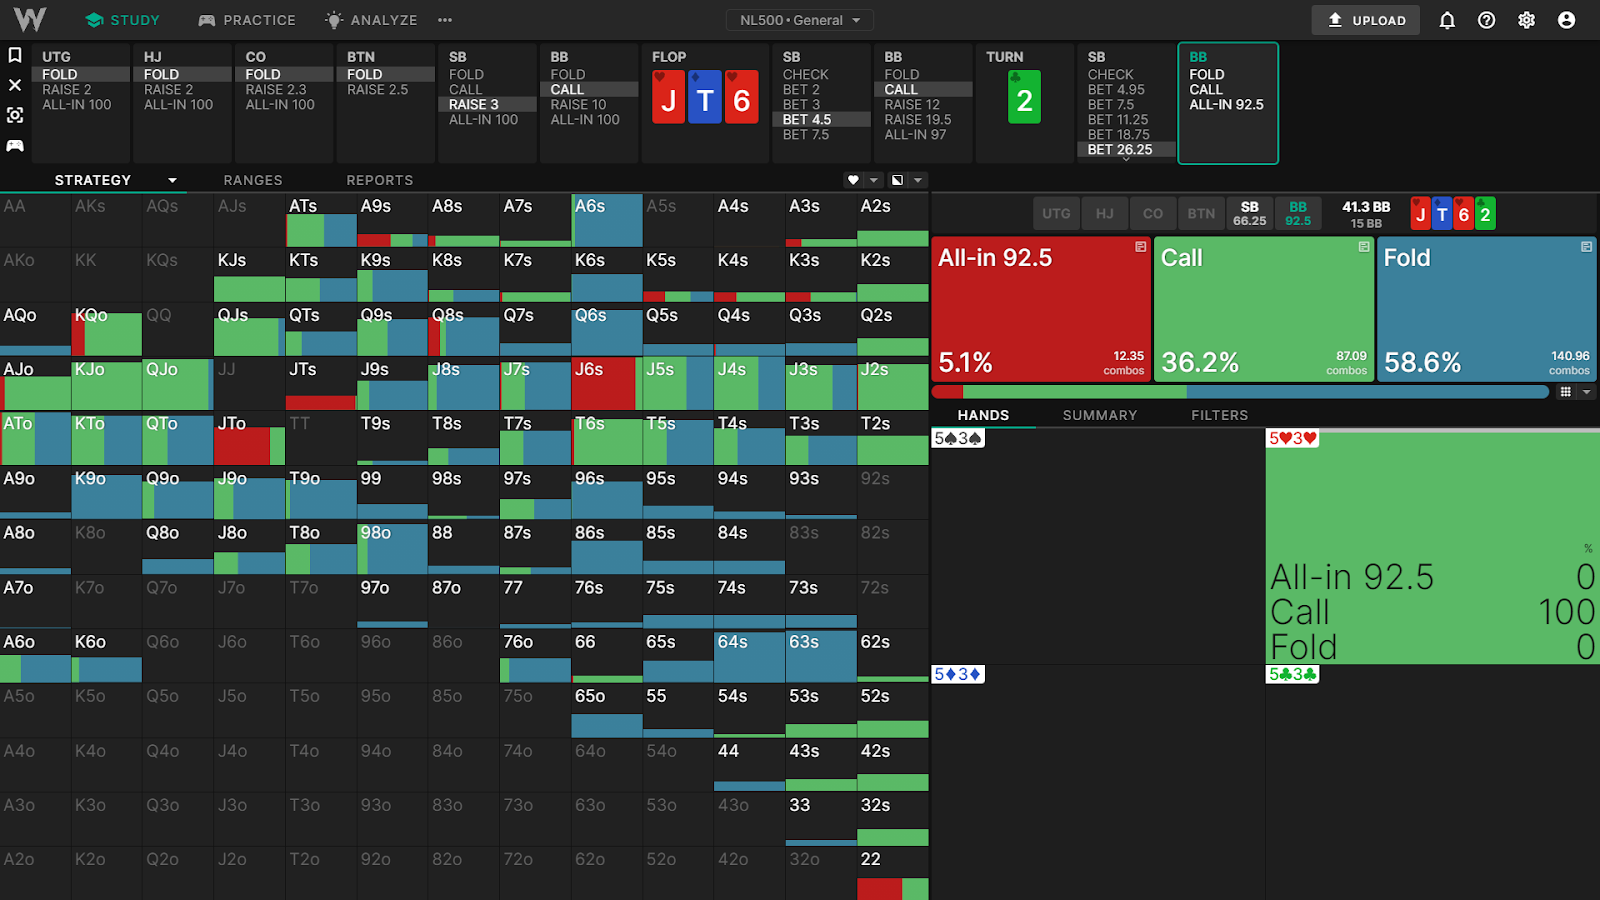
- SB opens, BB calls.
- Flop is J♥T♦6♥. SB bets 75%, BB calls.
- Turn is 2♣. SB overbets for 175%.
- Action is on BB with 5♥3♥.
Let’s start with a simple pot odds calculation. We (BB) are facing a 26.25bb bet, and the pot is 15bb. To break even on a call we need to win at least 26.25bb in the long run.
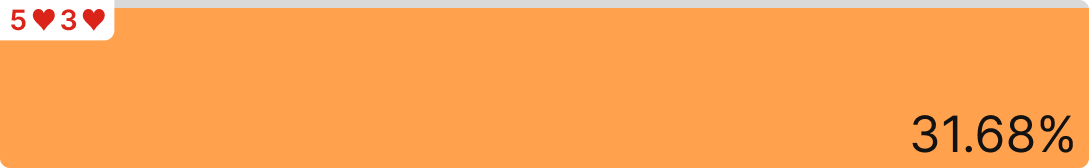
Imagine we’re holding a marginal combo draw like 5♥3♥, which only has 31.68% equity. Let’s look at our direct pot odds:
Required equity = (amount to call) / (pot after you call – rake).
BB needs 26.25 / (15 + (26.25 × 2) – 0.6) = 39.24% equity to call.
If the SB were shoving (or indeed if the river were always checked down), this would be an easy fold.
{{exclamation-mark}}
However, there’s still 66.25bb behind to play for after calling...
{{/exclamation-mark}}
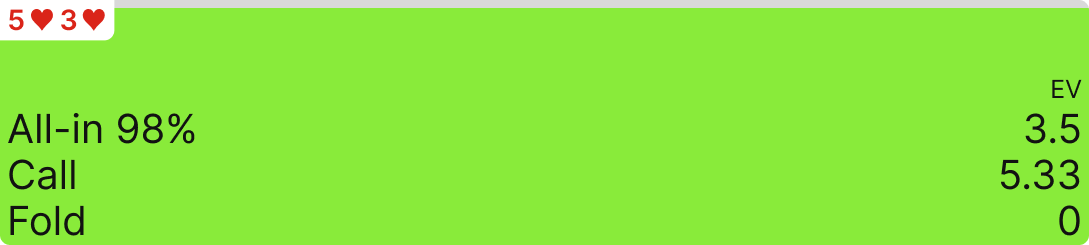
5♥3♥ expects to win more than its fair share of equity when it hits the draw due to implied odds.
Our EV with 5♥3♥ is 5.33bb higher than folding. What this actually means, is that we expect to win (26.25bb + 5.33bb = 31.58bb) after calling. After we call the bet the pot will be 67.5bb, so our expected pot share is (31.58 / 67.5) = 46.78% pot (ignoring rake).
{{width: 67%}}
{{/width}}
Let’s recap:
- Our raw equity is 31.68%
- Our pot share is 46.78%
In other words, we are over-realizing our (raw) equity by: 46.78/31.68 = 148%
More accurately, our expected value is higher than our raw equity would imply, because of our ability to outdraw value later on. This is the fundamental nature of implied odds.
Reverse Implied Odds
Reverse implied odds also exist. For example, sometimes you’ll hit your draw and lose a huge pot anyway. Sometimes a made hand won’t win its fair share of the pot due to being dominated or outdrawn on later streets. Making the second-best strong hand can severely cut into your profit margins.
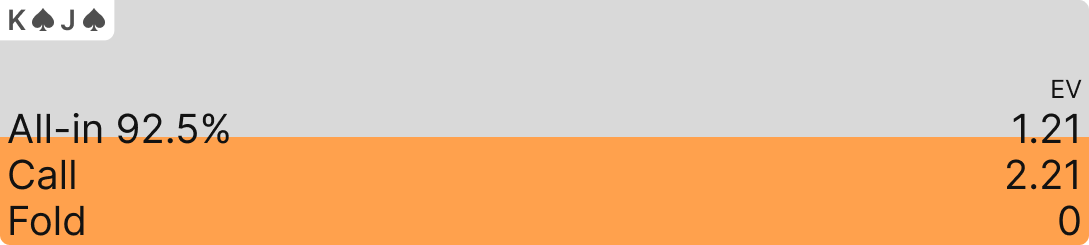
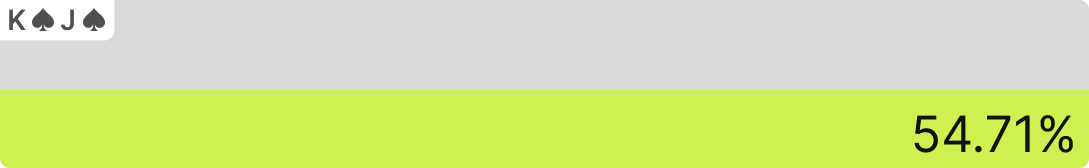
Let’s go back to our original J♥T♦6♥ 2♣ example and say we’re holding K♠J♠.
{{width: 67%}}
{{/width}}
K♠J♠ has good equity and is ahead of more than half of Villain’s range. However, it’s barely above breakeven against their overbet. When your opponent is polarized, your marginal made hands struggle to outdraw Villain’s value hands. These hands play closer to bluff catchers and have poor reverse implied odds.
Again, we need to win 26.25bb to break even, and K♠J♠ wins 26.25 + 2.21 = 28.46bb, or approximately 28.46/67.5 = 42% of the pot.
- Raw equity: 54.71%
- EV: 42.16%
- Equity realization = {{tooltip-title: 77%}}
{{tooltip-content: 77%}}
= 42.16%/54.71%
{{/tooltip-content}}
In other words, we only realize 77% of our raw equity.
{{question-mark}}
So where did the rest of our EV go?
{{/question-mark}}
Well SB has the ability to over-realize their equity and put our top pair in a lot of indifferent spots on the river. They can polarize over us with stronger value/bluffs, outdraw us and stack our top pair for a big profit. We won’t be able to call every river bet. We have a bluff catcher, that can’t extract value from worse because their range is so strong.
Let’s visualize this. Here’s our equity distribution facing their overbet. The dots on the line represent all our KJs. As you can see, most of the BB’s range is indifferent, as can be seen by that long flat line of bluff catchers.
{{width: 67%}}
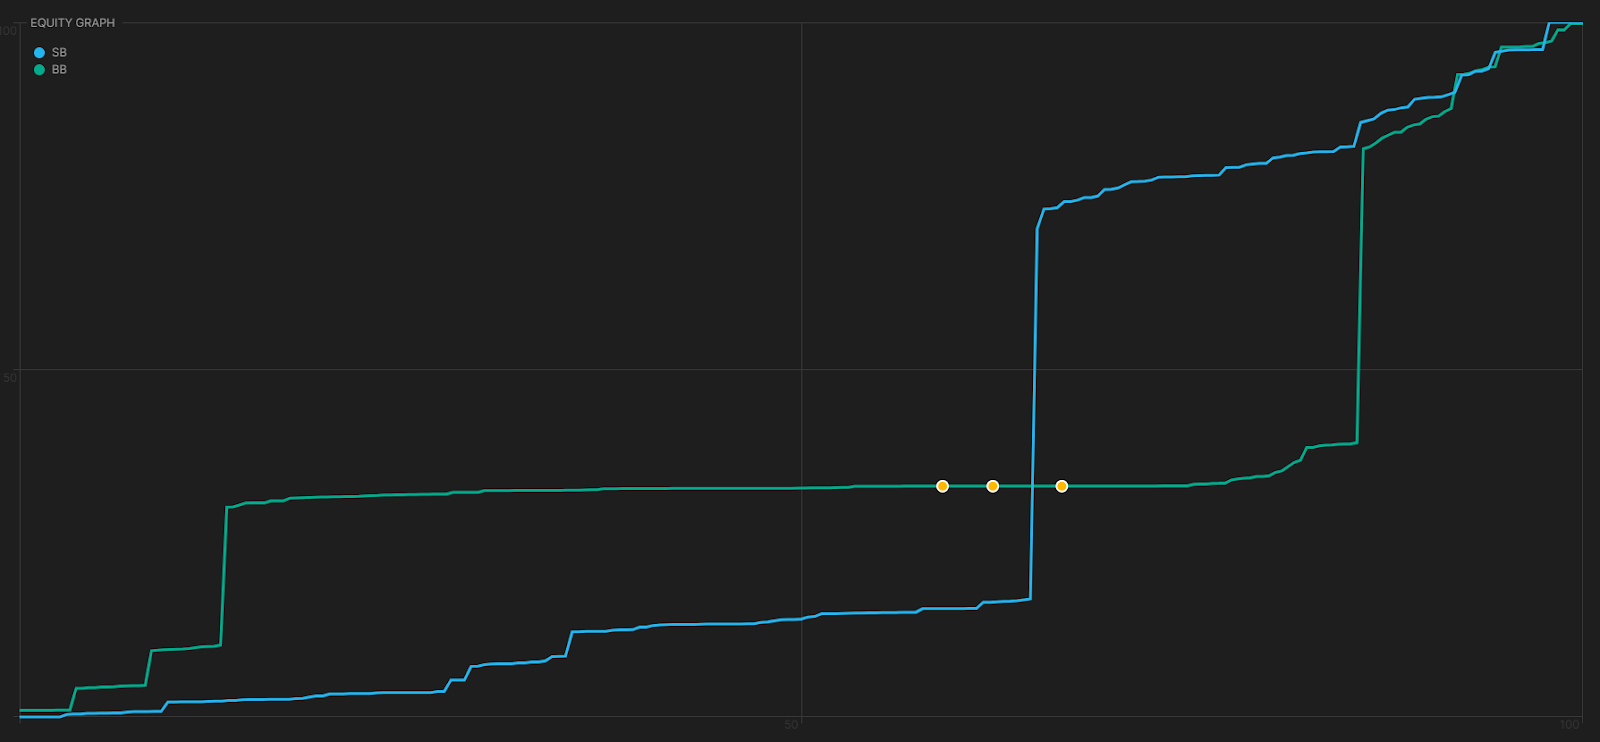
{{/width}}
How Implied Odds Relate to Stack Depth
Stack depth is the single largest factor when it comes to evaluating implied odds. Remember that “implied” indicates that we expect to win additional chips on later streets. The more chips we have behind, the more potential to win (or lose) chips on later streets, and the higher the implied/reverse implied odds.
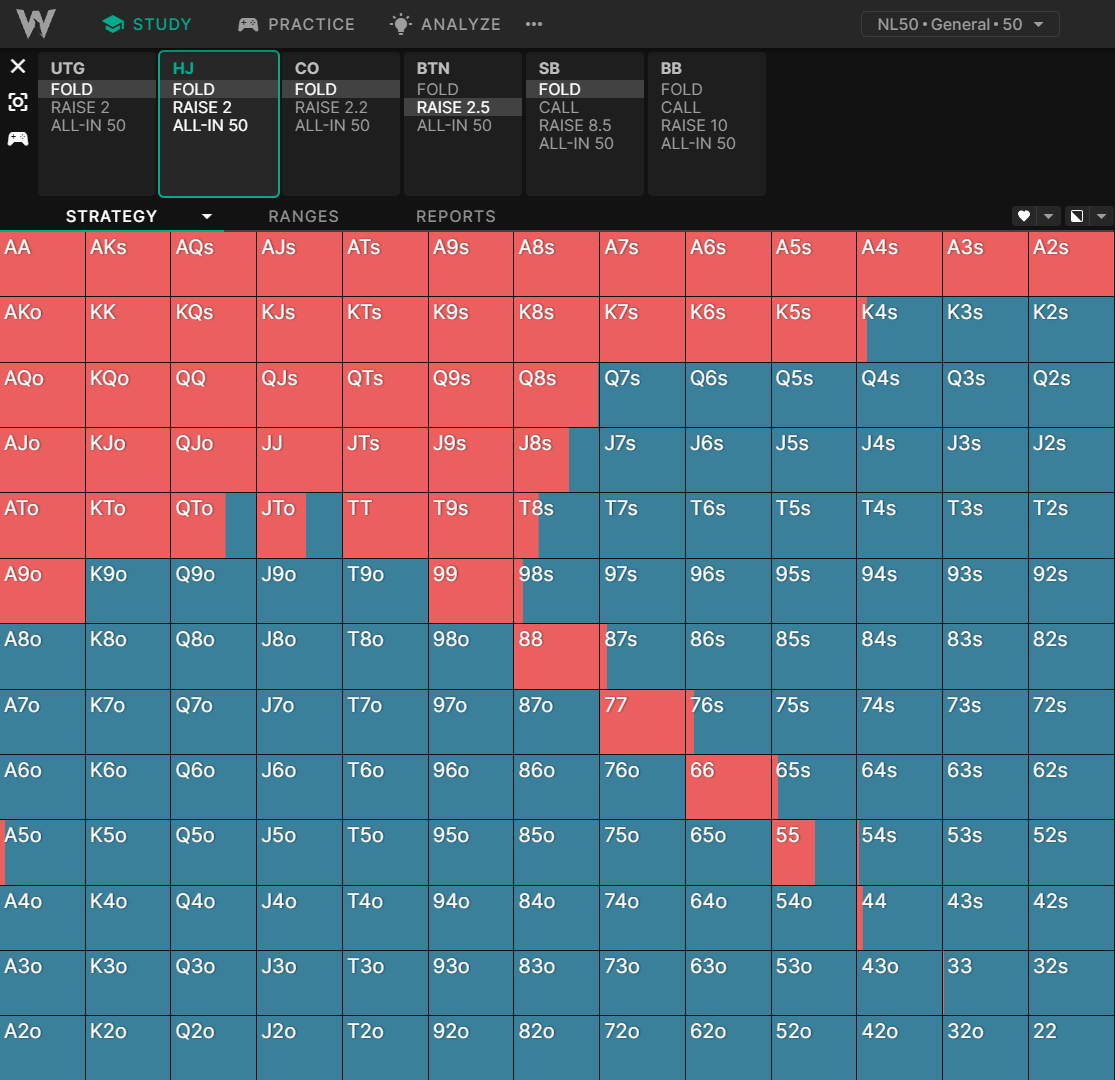
Let’s compare how the solver opens the HJ at different stack depths in a standard cash game:
HJ Open: 50bb deep
You should also consider how likely your opponent is to put in chips on later streets. For example, your flush draws have lower implied odds if they shut down on all flush-completing runouts.
{{width: 75%}}
{{/width}}
HJ Open: 100bb deep
{{width: 75%}}
{{/width}}
As we get deeper, we see a preference towards hands like lower pocket pairs, suited connectors, and generally hands with better implied odds. The effect is subtle, but it’s even more pronounced in tournament charts:
{{width: 75%}}
{{/width}}
We can see the range expanding from high-equity shoves at low stack depth to more “playable” hands with better implied odds at a deeper stack depth. The range retracts at 60bb+ as other players can enter the pot with a wider range due to improved implied odds.
Visualizing Implied Odds Through Multiway Equity Retention
Implied odds are connected to a hand’s ability to draw to something nutted. We sometimes call this effect “playability.” The following gif is a color-coded equity distribution of 2–14 players with any two cards. Here we can see how equity evolves multiway. Tip: Pay attention to the gradient rather than the exact numbers.
{{width: 75%}}
{{/width}}
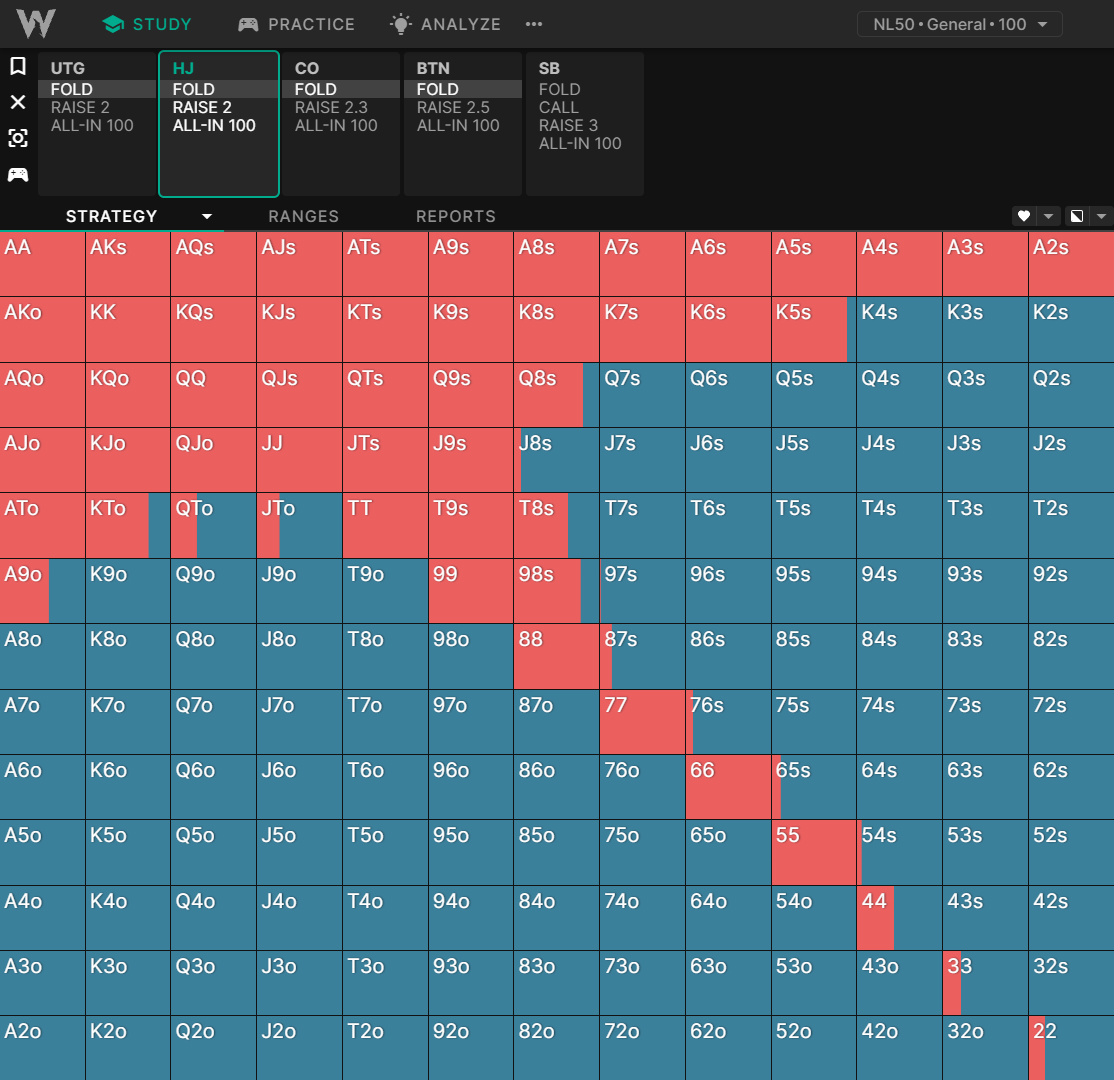
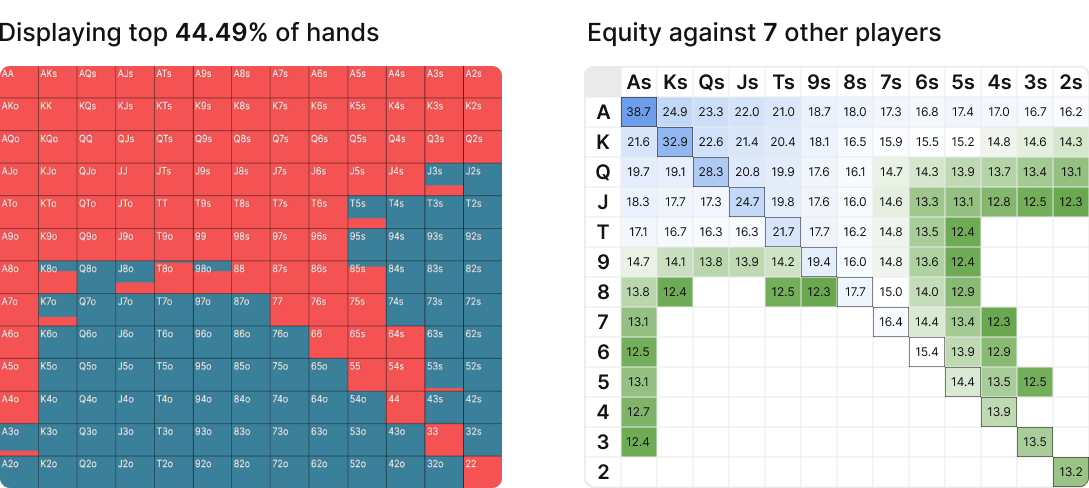
To my surprise, I’ve found that by tweaking the number of players (adjusting the value of implied odds) you can create equity gradients that roughly resemble GTO opening ranges. For example, here’s the equity gradient for the top 44% of hands next to a standard 100bb BTN opening range.
Try this spreadsheet yourself!
Even though there are only 3 players left in the hand, the value of implied odds gets exaggerated 100bb deep. In order to replicate the GTO EV gradient, I’ve artificially increased the implied odds by increasing the multiway equity calculations to 8 players.
As we add more players, the equity gradient shifts towards more suited and connected hands that have a better chance of drawing to something nutted.
In this way, we are treating implied odds as an adjustable parameter to artificially highlight the intrinsic implied odds of different kinds of hands (or more accurately, the inherent ability of a hand to draw to something strong).
Even though there are only 3 players left in the hand, the value of implied odds gets exaggerated 100bb deep. In order to replicate the GTO EV gradient, I’ve artificially increased the implied odds by increasing the multiway equity calculations to 8 players. This kind of analysis underestimates blocker effects which makes it harder to replicate early position opening ranges. Regardless, I hope you’ve enjoyed this visual representation of implied odds as much as I enjoyed creating it!
Monkey in the Middle: 3-Way Pot Heuristics
In this article, we will discuss the key strategic differences between this scenario and one where you face a continuation bet in a heads-up pot, how those differences factor into the GTO responses to these bets in 3-way pots, and when those differences are more or less salient.

The Trouble With Implied Odds
When we were brand new to poker strategy, many of us learned about concepts like equity, outs, and pot odds. When drawing, we were taught to count our outs, use those to estimate our equity, and then call or fold based on whether we were getting the right pot odds for the equity we had.
Poker Concepts You’re Using Wrong (and How They’re Hurting Your Winrate)
Language and poker are two of my great passions in life, so I’ve always been interested in poker’s unique and colorful vocabulary. As a poker coach, podcaster, and writer, I have particularly strong opinions about the language we use to explain poker strategy.