When does ICM become significant in MTTs?

Overview
The Independent Chip Model (ICM) was invented in 1987 by M. Malmuth and is one of the most important formulas for understanding tournament poker strategy! But it took us almost 35 years to fully utilize the concept…
ICM is great at evaluating tournament stacks, but until recently, it was nearly impossible to calculate for large-field MTTs with many players remaining. So instead, everyone has been evaluating tournaments with Chip EV models when many players remain. Recent advances in poker science now allow us to calculate ICM when hundreds or even thousands of players remain. This begs one important question though – at what point does ICM become significant in tournaments? When is it worth switching to ICM solutions? We ran a series of experiments in partnership with Helmuth, founder of Holdem Resources Calculator, to find out 🧪💥🔍
Quick Recap – What is ICM?
The Independent Chip Model is a mathematical formula that converts your tournament stack from chips to dollars. ICM uses stack sizes alone to determine how often a player will finish in each position (1st, 2nd, etc.), then assigns tournament equity based on the payouts of those positions. Tournament equity is just your expected share of the prize pool, given the payout structure, your position in the event, and stack sizes. Read this article if you want to learn more about how ICM is calculated. Watch this video if you want to understand ICM using a more visual and intuitive approach.
ICM vs Chip EV
Chip EV = A strategy that maximizes chips
ICM = A strategy that maximizes dollars
These two are not the same. The fundamental tradeoff of ICM is that it sacrifices chips sometimes to win more money. This is because of a concept called “Risk Premium”. In MTTs, it can sometimes be worth avoiding marginal spots to survive longer. Losses hurt more than equivalent chip gains help. Conversely, a chip leader may get to play more aggressively as they expect the other stacks to play more cautiously. This risk-averse dynamic doesn’t exist within a chip EV strategy. A chip EV strategy simply maximizes chips without fear.
So is this tradeoff valid? Should you sacrifice chips for dollars? 🤔💬
Read more to find out.
Methodology
The goal of these experiments is to find out at what point ICM becomes a significant factor in MTTs. At what point should you switch from a Chip EV model to an ICM model? We’ve run a series of experiments to find out. We’ve simulated a number of tournaments with different strategy profiles competing against each other.
The contestants
- ICM 100% (Pure ICM)
- cEV 25% -> ICM 75%
- cEV 50% -> ICM 50%
- cEV 62.5% -> ICM 37.5%
- cEV 75% -> ICM 25%
- cEV 95.5% -> ICM-FT (Final Table only)
For example, this contestant: (cEV 25% -> ICM 75%). Uses a Chip EV strategy until 25% of players are eliminated. Then they switch to an ICM strategy for the remaining 75% of the MTT. Each tournament contains an equal sample of each strategy profile. We’ll tabulate their results and see at what point switching to ICM has a significant impact on results.
Experiment #1 – 200 Player Freezeout
The Setup
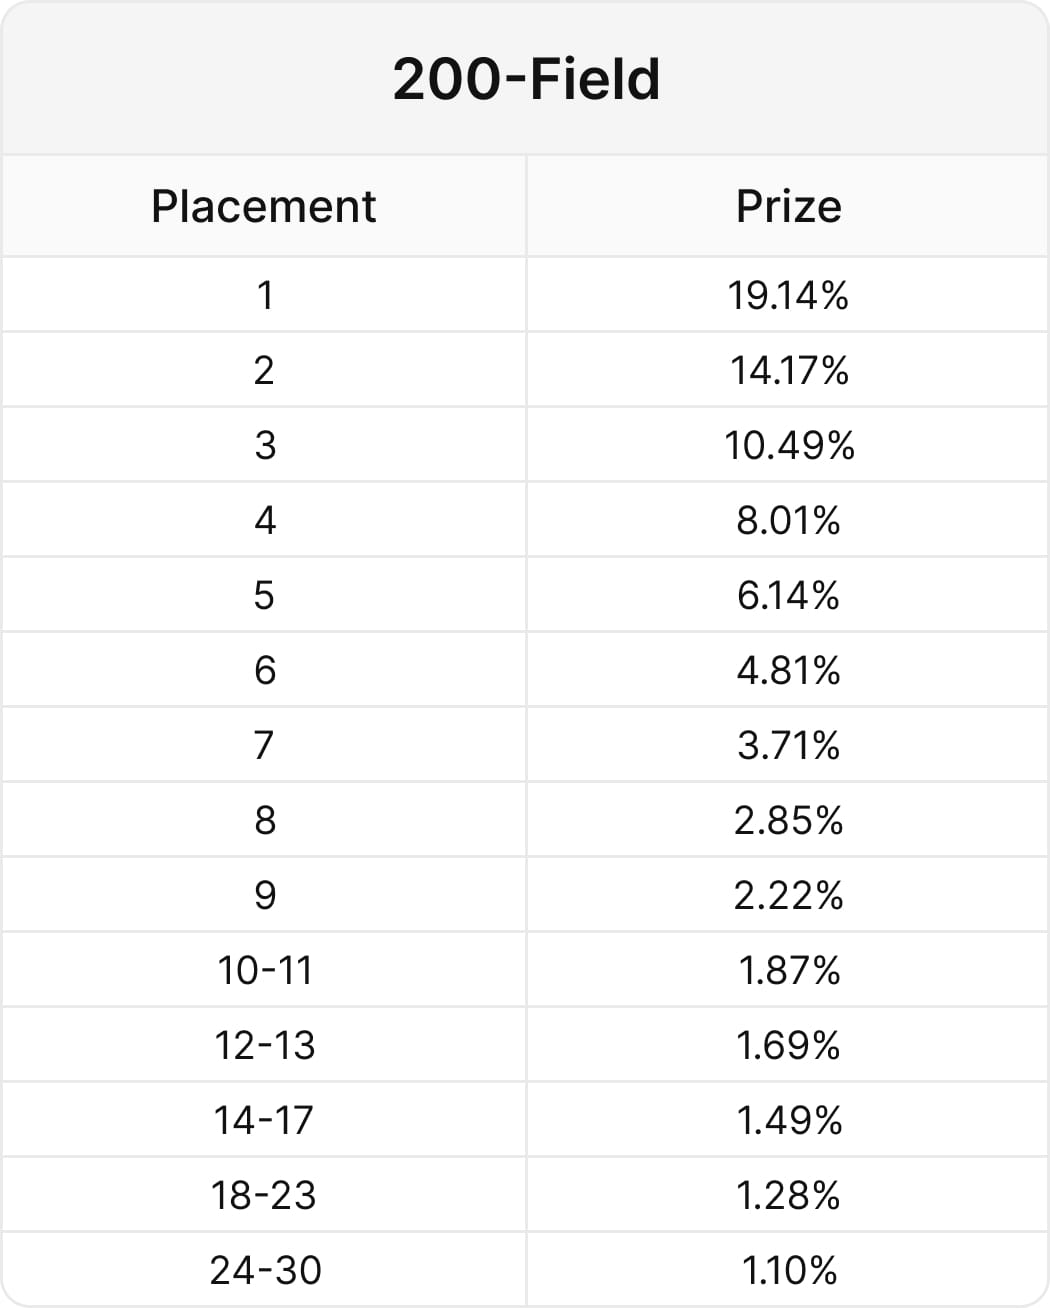
- 200-player MTT Freezeout
- 15% of field paid
- Push/Fold
- BB = 1/7th average stack
- Six different types of strategies
- Every player knows and adjusts to each other’s strategies
- Sample Size: 500,000 TournamentsWe’ve run a 200-player freezeout. It’s a push/fold tournament where the BB is normalized to 1/7th of the average tournament stack, (average stack = 7BB). This gets updated every time a player is eliminated. It’s a push/fold event, so we only simulate preflop strategies. Every player knows and adjusts to each other’s strategy.
{{width: 75%}}
{{/width}}
The Results
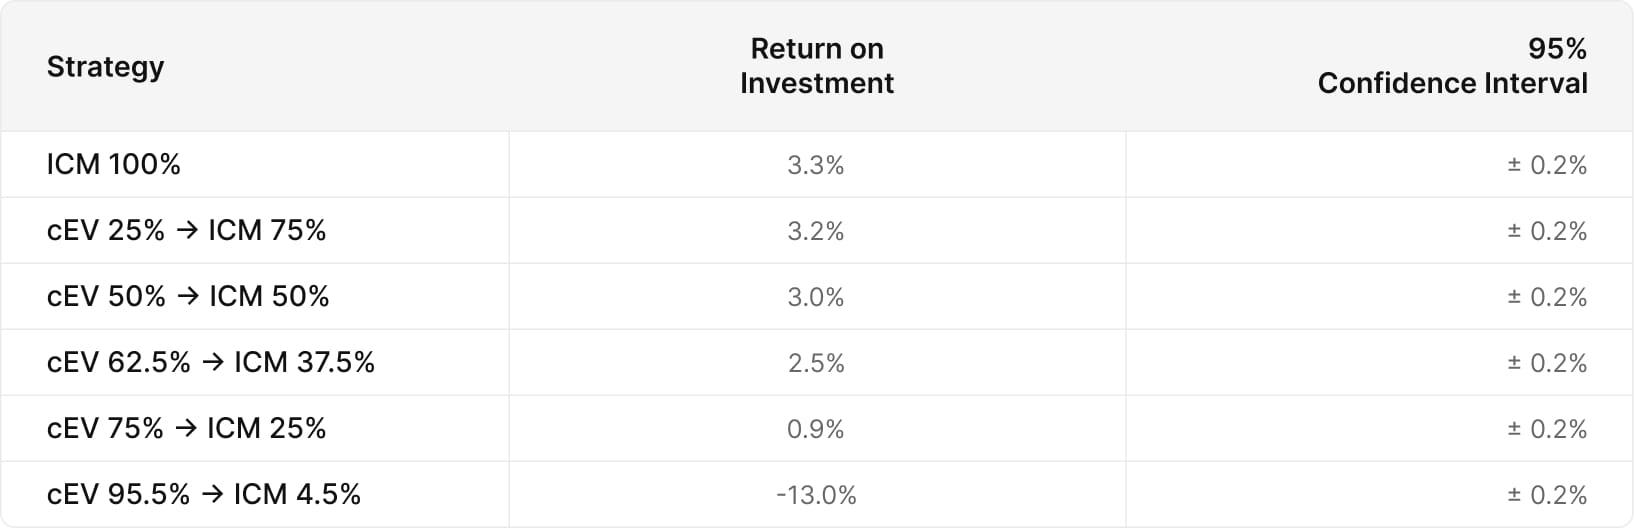
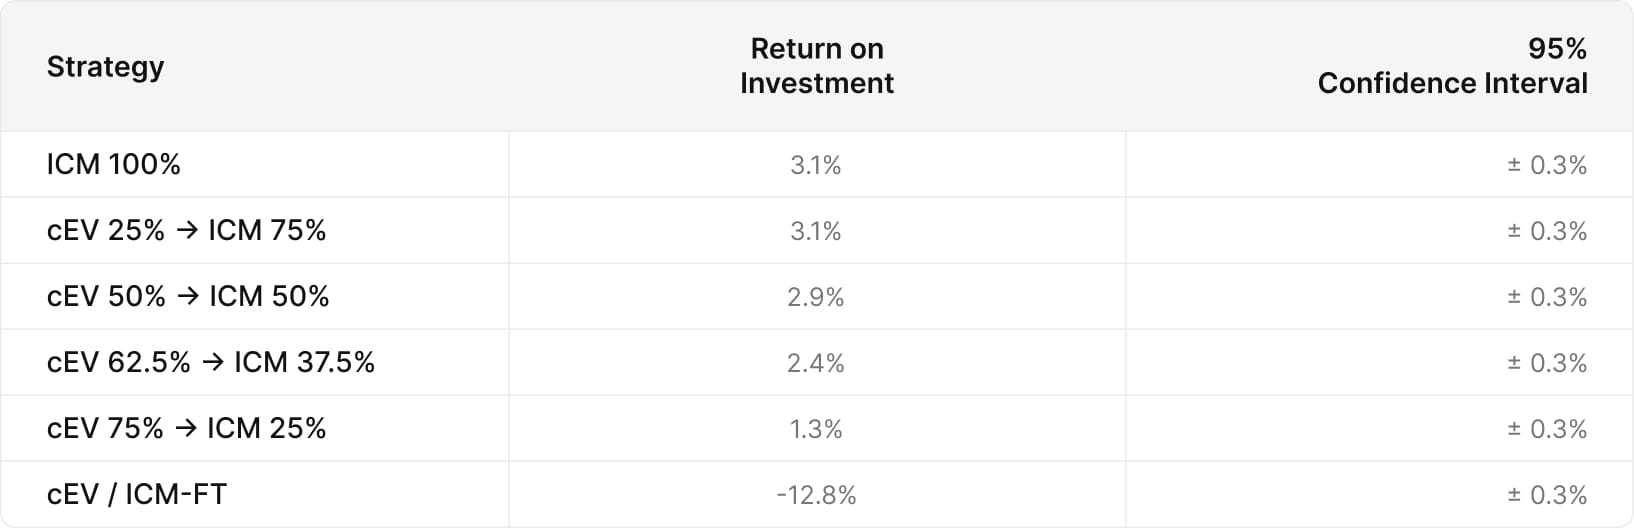
The following graph displays the average return on investment for each strategy profile. As you can see, players who switch to ICM sooner average higher returns.
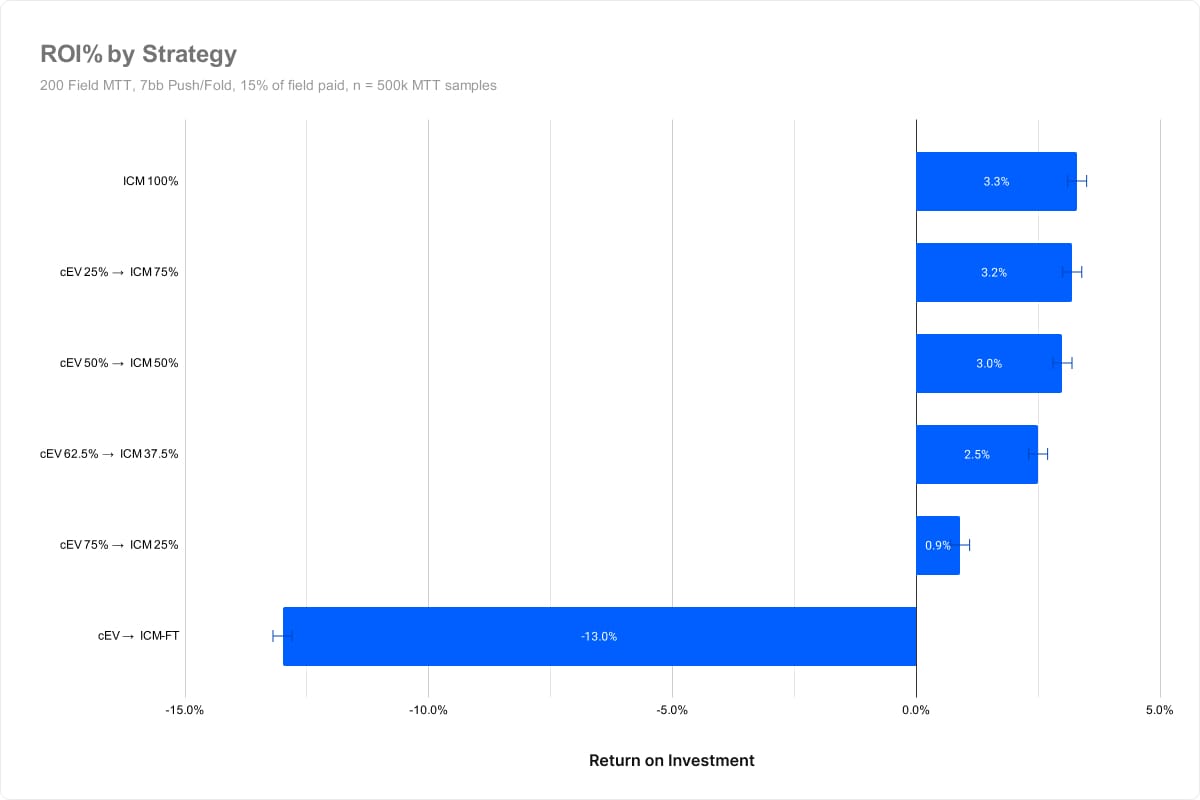
We see a slight drop-off beginning between 50% of the field remaining and 37.5% of the field remaining. At this point the losses exceed statistical significance, indicating that this loss is not a result of variance.
The result surprised us as it indicates ICM becomes a significant factor well before the bubble. Since 15% of the field is paid, the bubble occurs at 15% of players remaining. Yet we see the (cEV 75%/ICM 25%) losing significant value despite switching to ICM well ahead of the bubble.
At the very bottom we see (cEV 95.5%/ICM 4.5%) losing 13% of their buy-in on average. This contestant type uses a Chip EV evaluation, trying to maximize chips, only switching to ICM on the final table.
{{toggle:Detailed results}}

{{/toggle}}
Placements
Let’s explore where exactly these edges are coming from. The following graph displays the cumulative ITM payouts for each strategy profile:
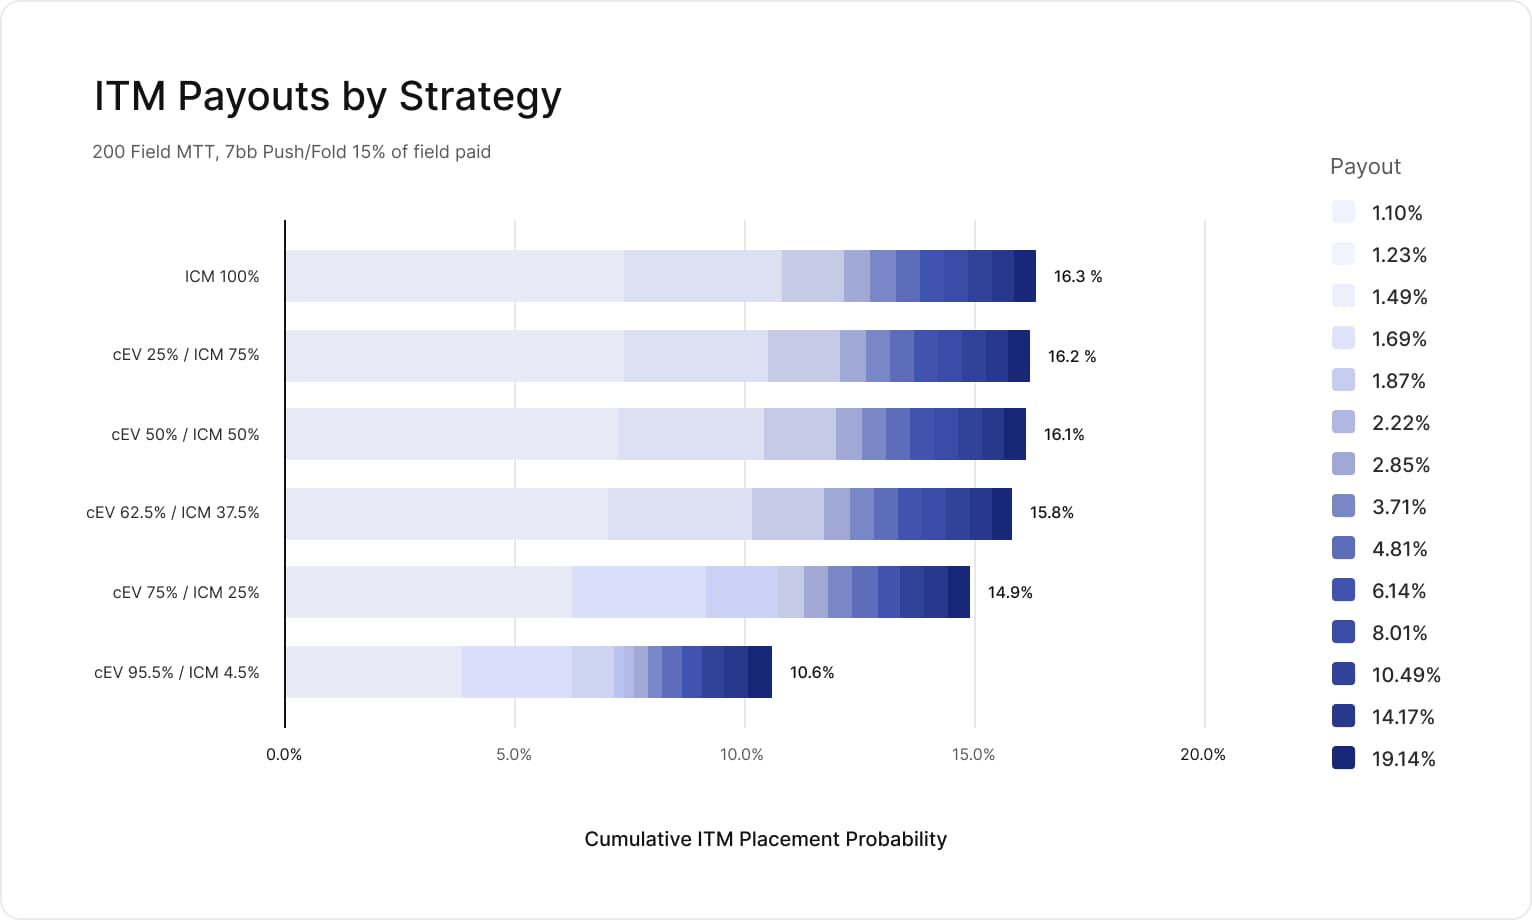
We can see that the strategies which switch to ICM sooner are also cashing in the money a lot more often. This is the primary reason why ICM is winning more money overall.
We can break this down further. The following chart displays how often each strategy achieves each placement:
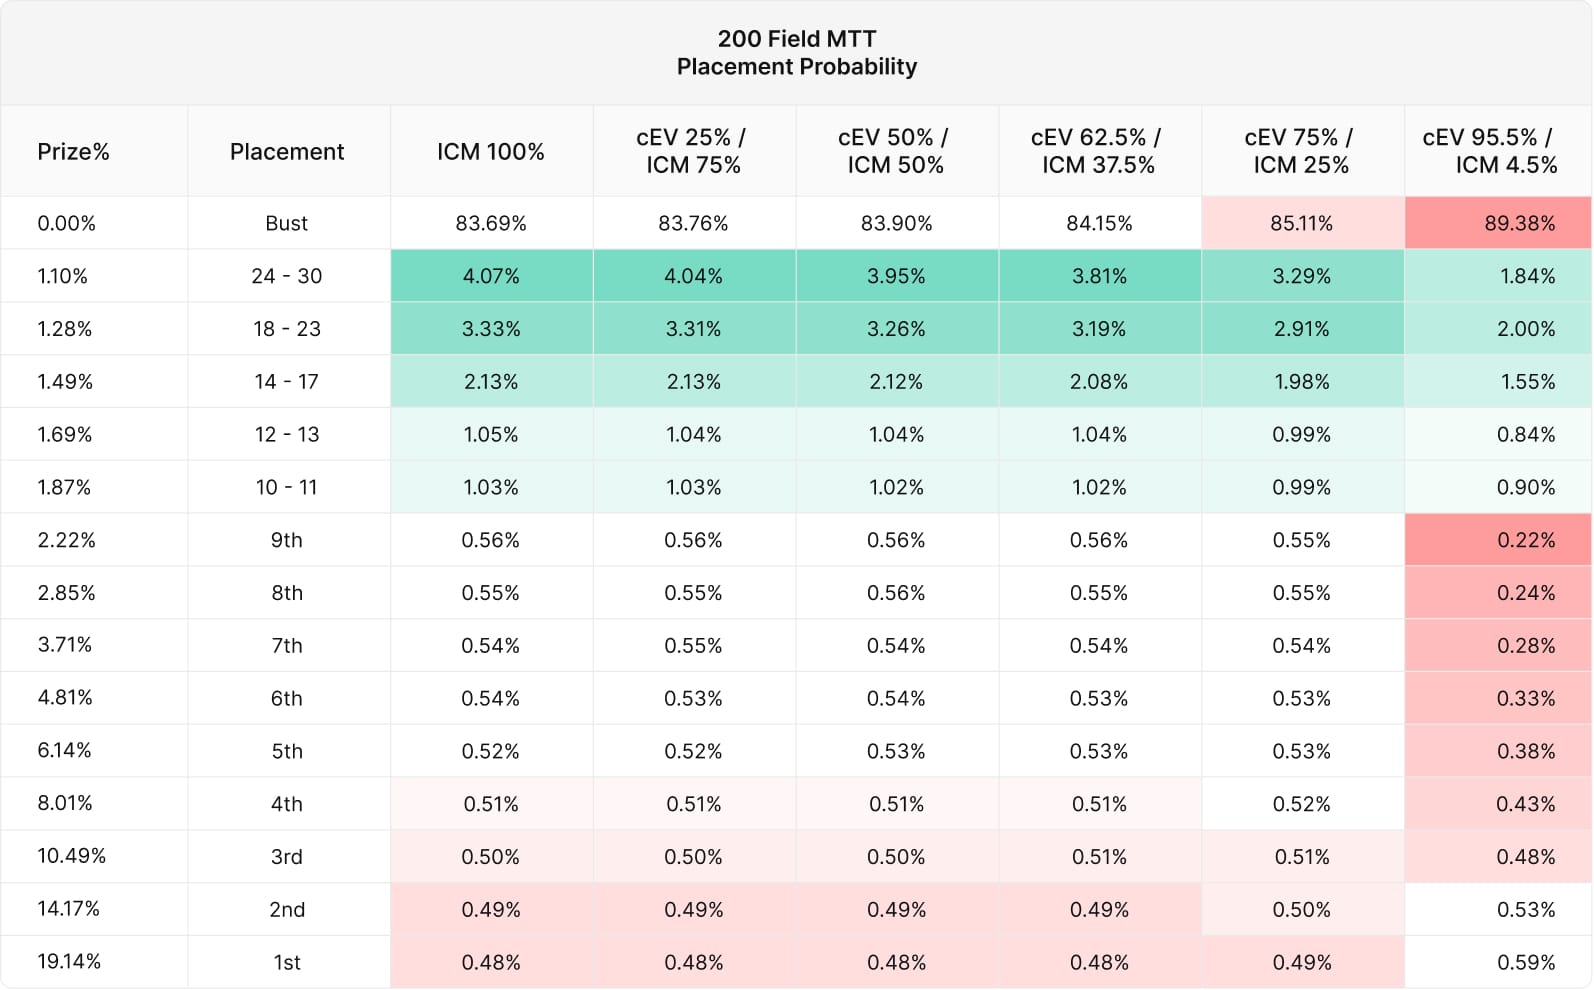
We can see that the (cEV 95.5%/ICM4.5%) on the right is busting a lot more often and placing less often. Recall that this strategy profile uses chip EV until the final table.
Despite that, the cEV strategy places 1st more often than other strategies. This is actually exactly what we expect! ICM, (and other MTT equity models) predict that your probability of placing first is equivalent to your fraction of chips in the tournament. So a strategy that maximizes chips will place 1st more often, sacrificing ITM placements to do so.
Proportional Change to Baseline Placements
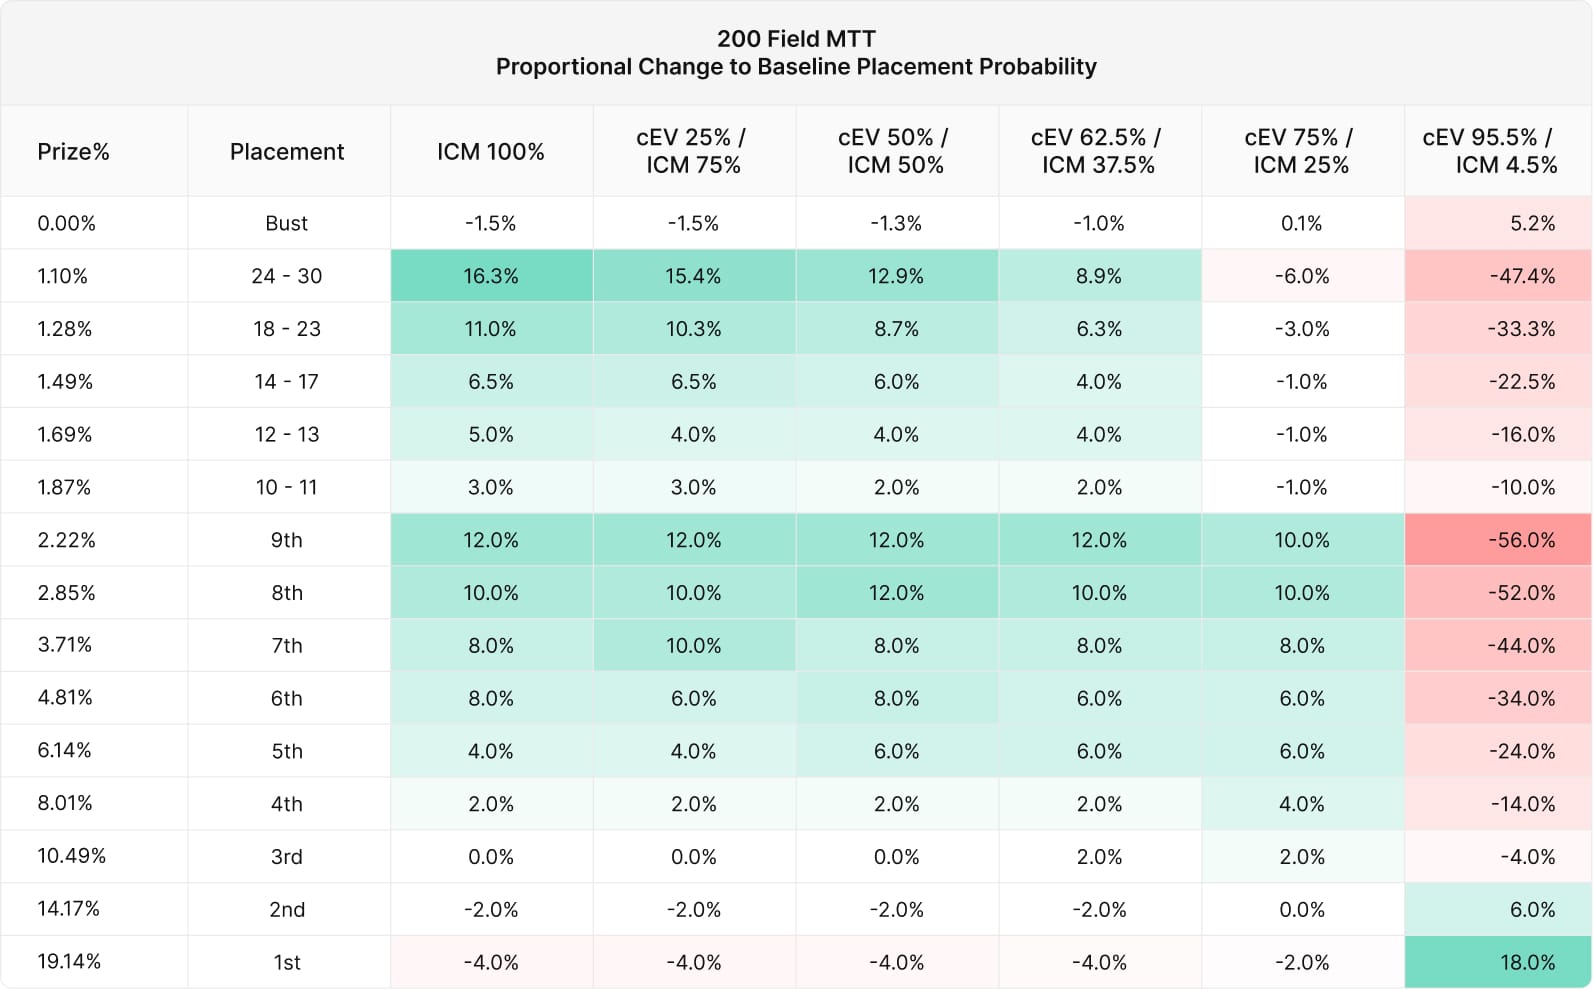
We can compare the placements above to a “baseline” probability. The following chart displays the proportional change to baseline placement probability.
- Baseline probability = How often each player would place if chosen at random.
- Proportional change = Actual placement probability / baseline placement probability – 1
In other words, the (cEV 95.5% / ICM 4.5%) strategy is 18% more likely to place first compared to random, but also 5.2% more likely to bust.
Expected Value
The most important question here is a matter of expected value. We’ll use a $100 buy-in, multiply each placement frequency by the expected value of its prize to see where the strategies are gaining or losing value. The prize pool for this tournament would then be $20,000.
EV=Prize% × Prize pool × Placement frequency–$100 buy-in
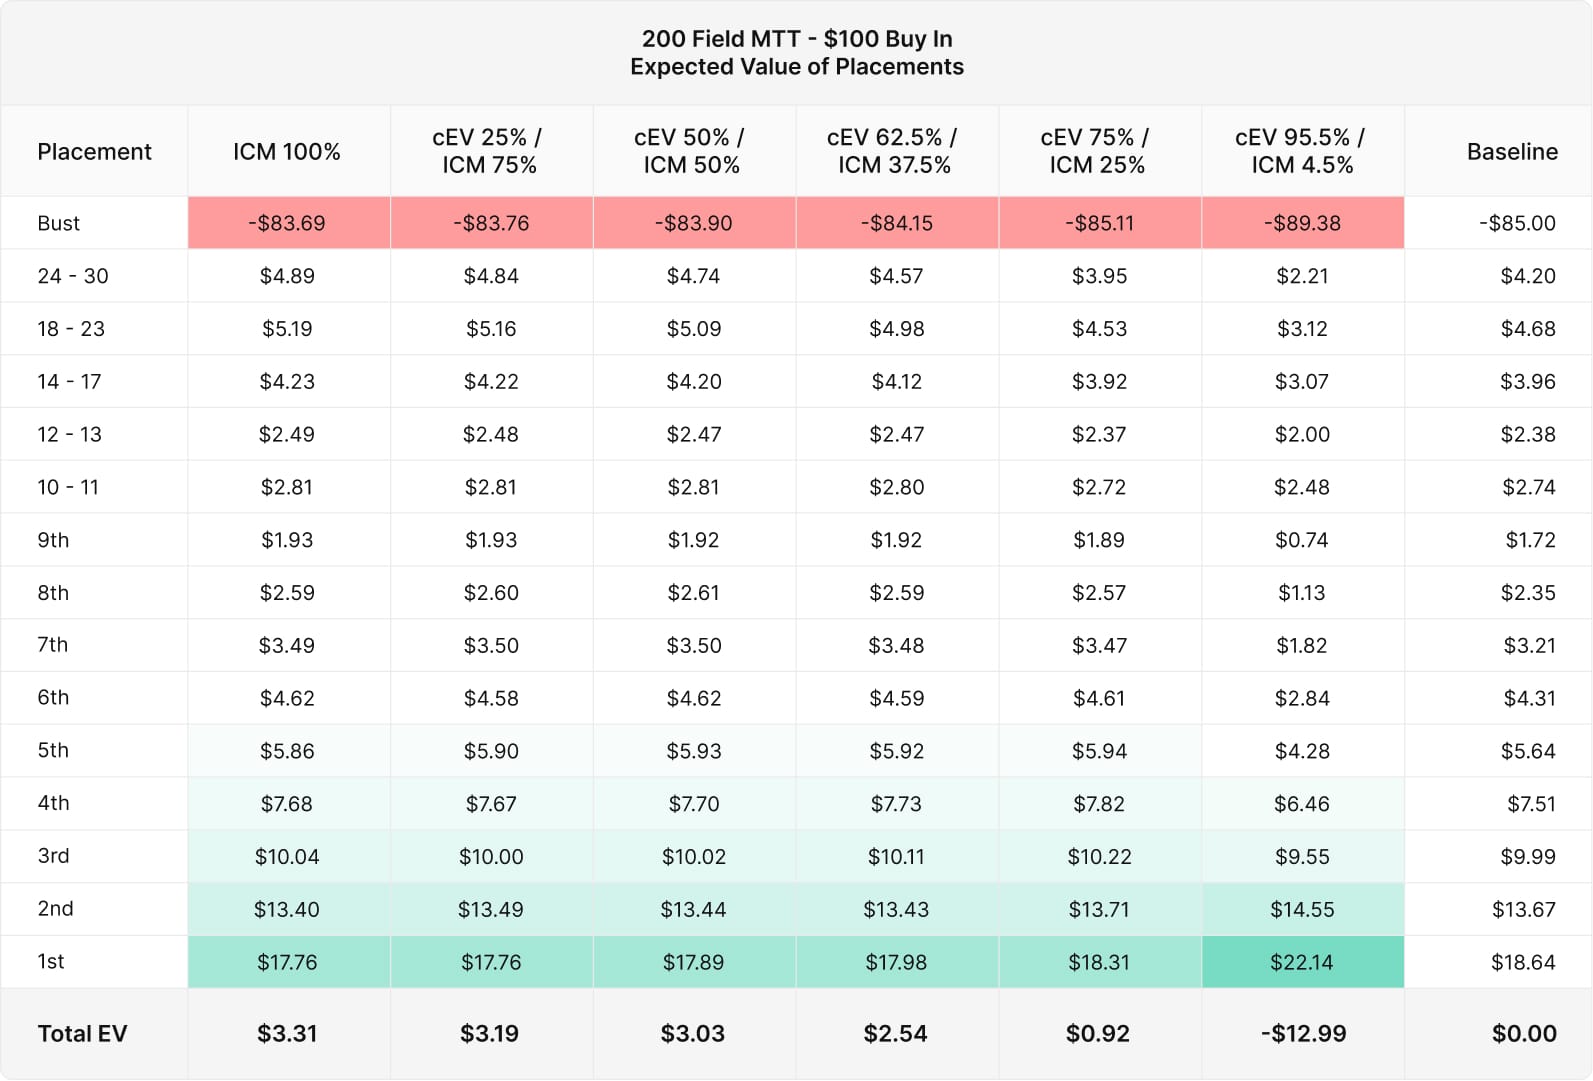
It’s interesting to see how much money comes from each placement within the tournament.
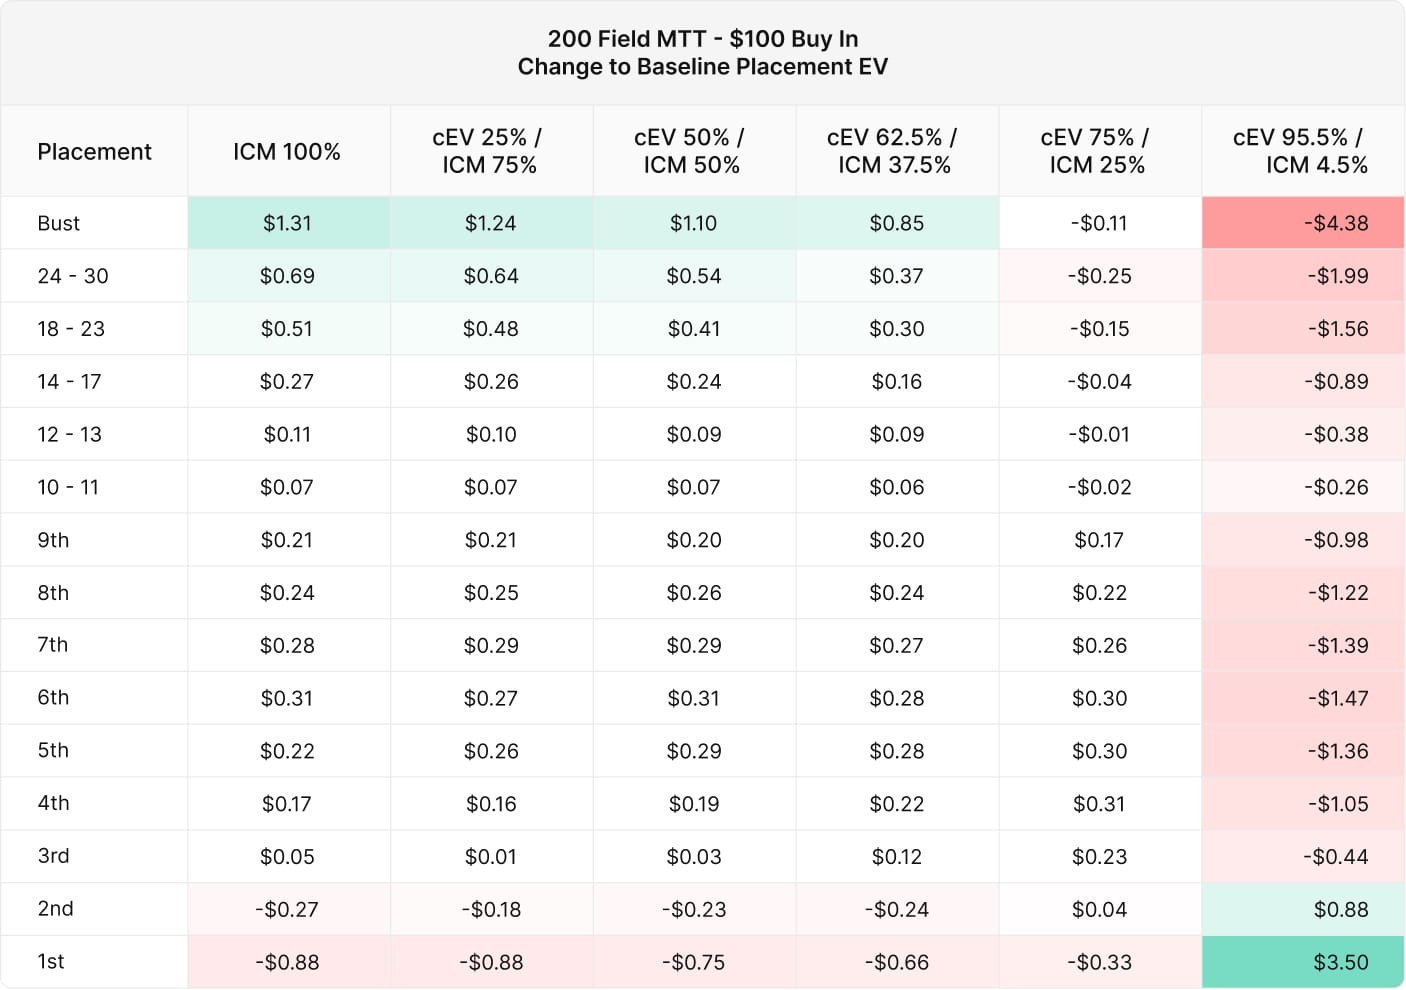
This table is easier to interpret as a change to baseline EV. The ICM 100% through ICM 37.5% strategies gain EV everywhere except for the 2nd and 1st placement. This demonstrates the power of the fundamental ICM tradeoff – in MTTs survival is king. Meanwhile, the ICM 25% strategy and beyond sacrifice bubble placement EV in exchange for higher EV in the upper placements.
Lastly, we can graph the expected value of placements by strategy.The lines here are very close with one major outlier – the (cEV 95.5% / ICM 4.5%) strategy.
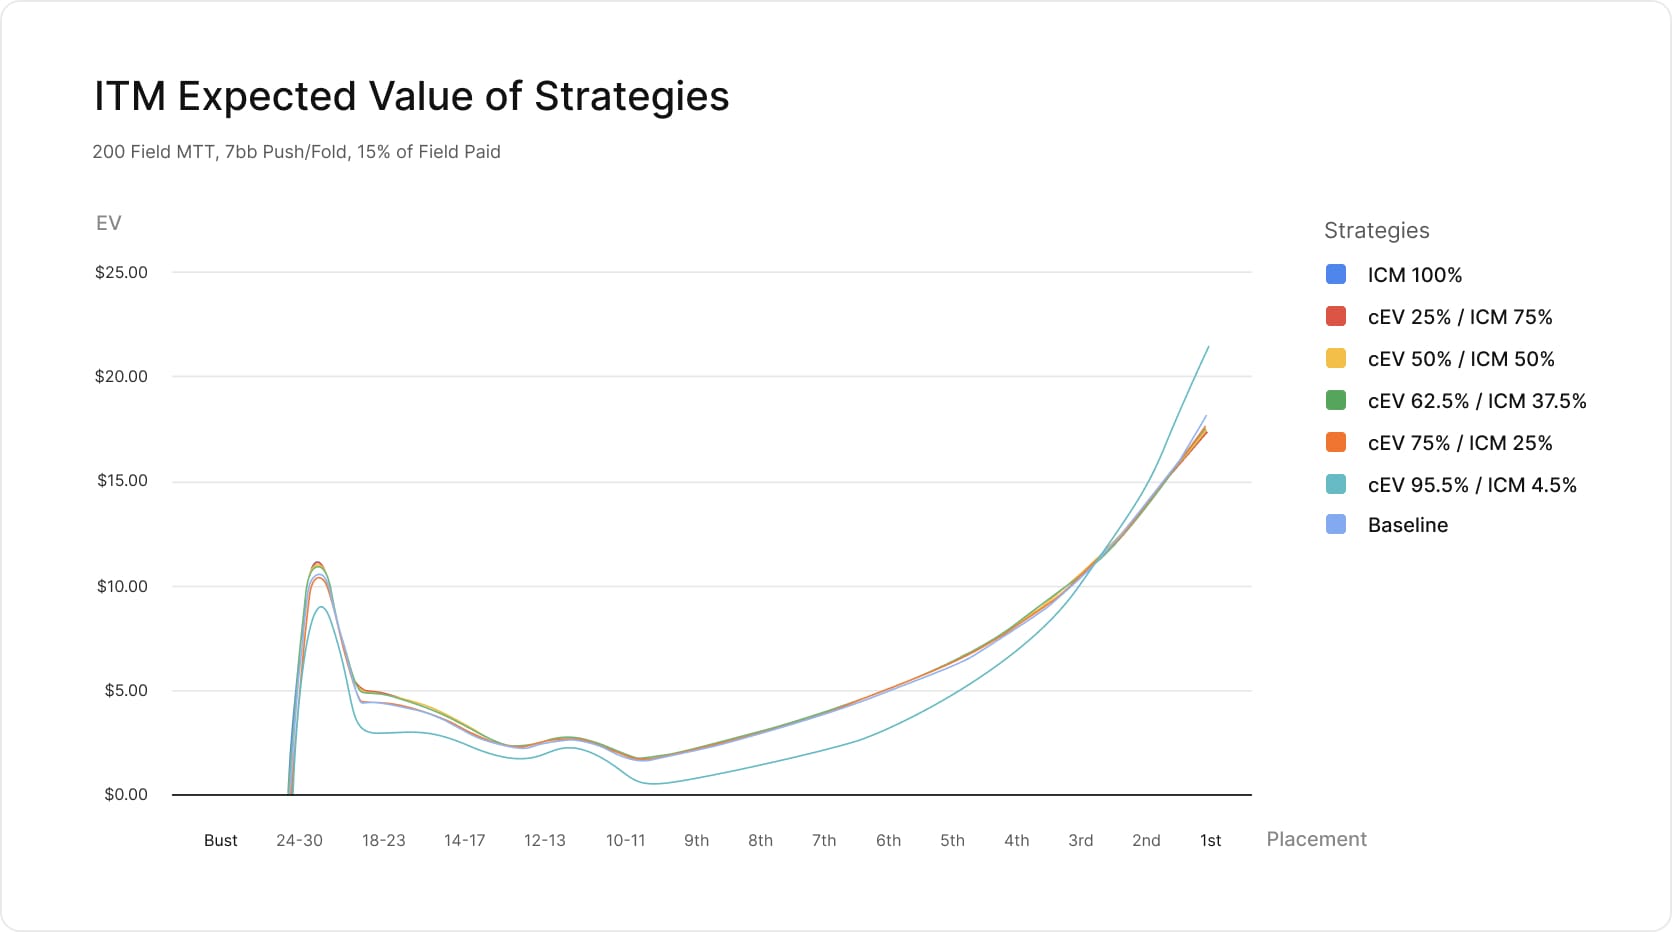
This graph makes it clear that the cEV strategy is sacrificing a lot of money in order to maximize chips and go for 1st. This line diverges so much from the others that it makes it difficult to see the smaller differences between the other strategies.
Experiment #2 – 1000 Player Freezeout
Replication is one of the key ways scientists build confidence in the merit of results. Repeating experiments and isolating variables are among the core principles of the scientific method.
For our next experiment, we’ll repeat the methodology above using a larger field. We should consider that these results may be a fluke of the prize structure or field.
The Setup
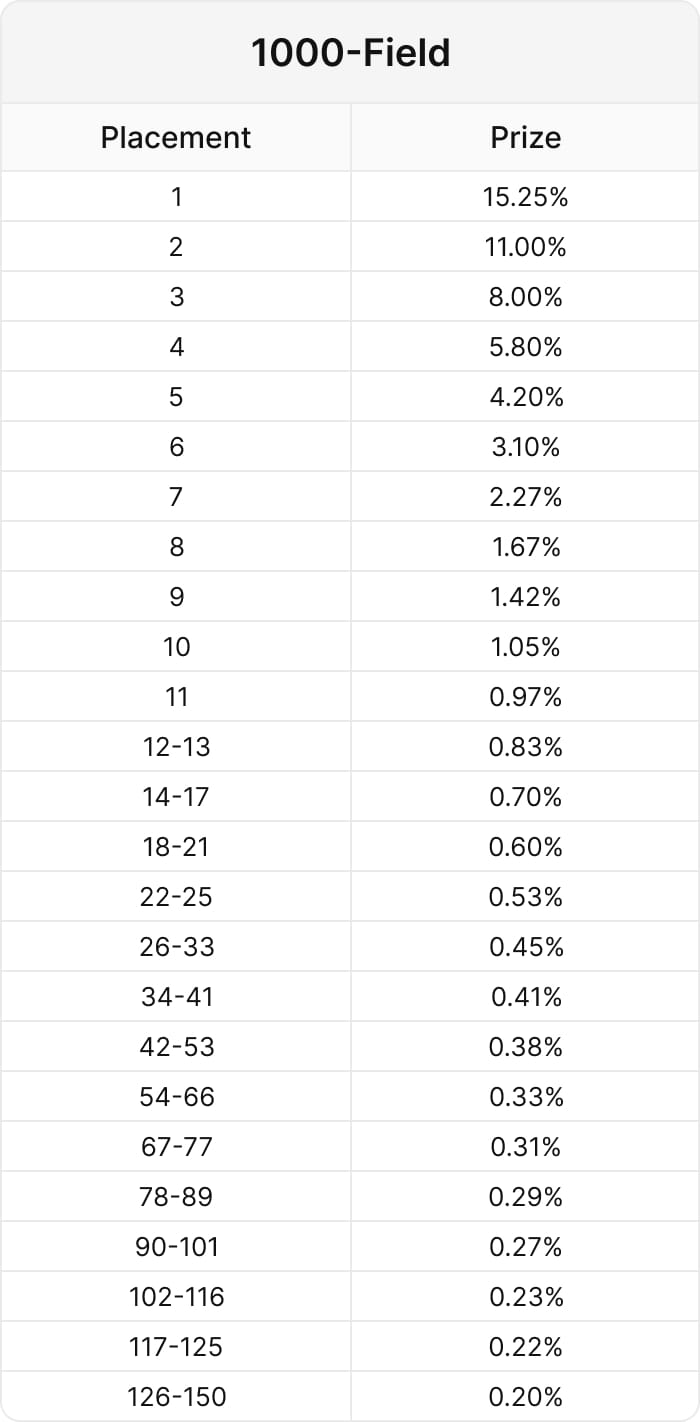
We’ll use the same setup as before, this time simulating a 1000-player freezeout.
- 1000-player MTT Freezeout
- 15% of field paid
- Push/Fold
- BB = 1/7th average stack
- Six different types of strategies
- Every player knows and adjusts to each other’s strategies
- Sample Size: 100,000 Tournaments
{{width: 75%}}
{{/width}}
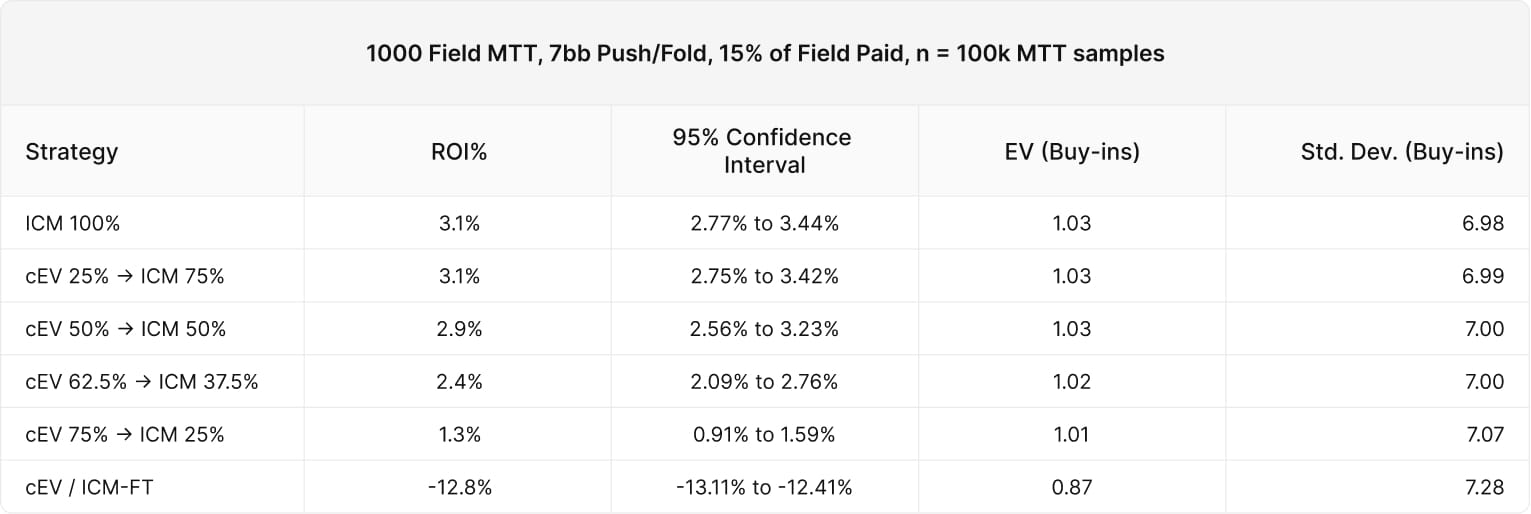
The Results
Just as before, we see strategies that switch to ICM sooner doing better on average. The ROI% drop-off seems to begin somewhere between (cEV 50% / ICM 50%) and (cEV 62.5% / ICM 37.5%).

In both experiments, it appears that ICM has a statistically significant impact on results between 50% and 37% of the field remaining, well ahead of the 15% bubble. It should be noted that the confidence interval precludes us from claiming that pure ICM is better than ICM 50%, although the general trend seems consistent with our earlier results.
{{toggle:Detailed results}}
{{/toggle}}
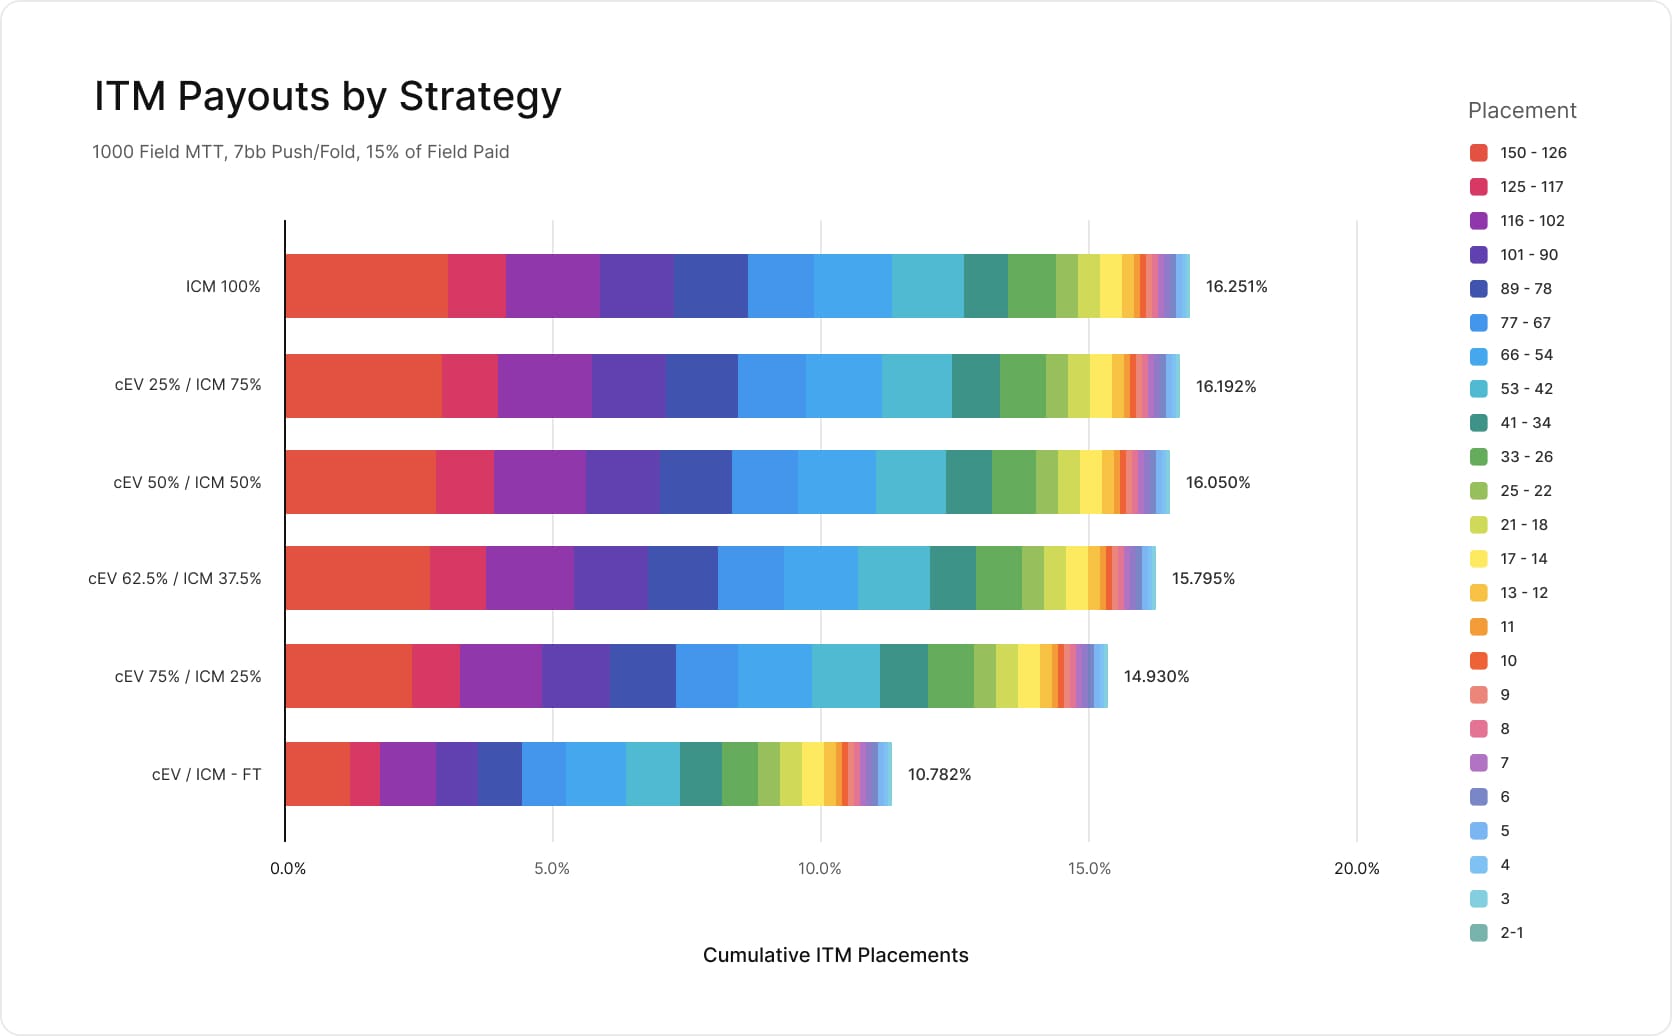
Placements
Here we see the same trend as before – players who switch to ICM sooner are placing ITM more often overall.
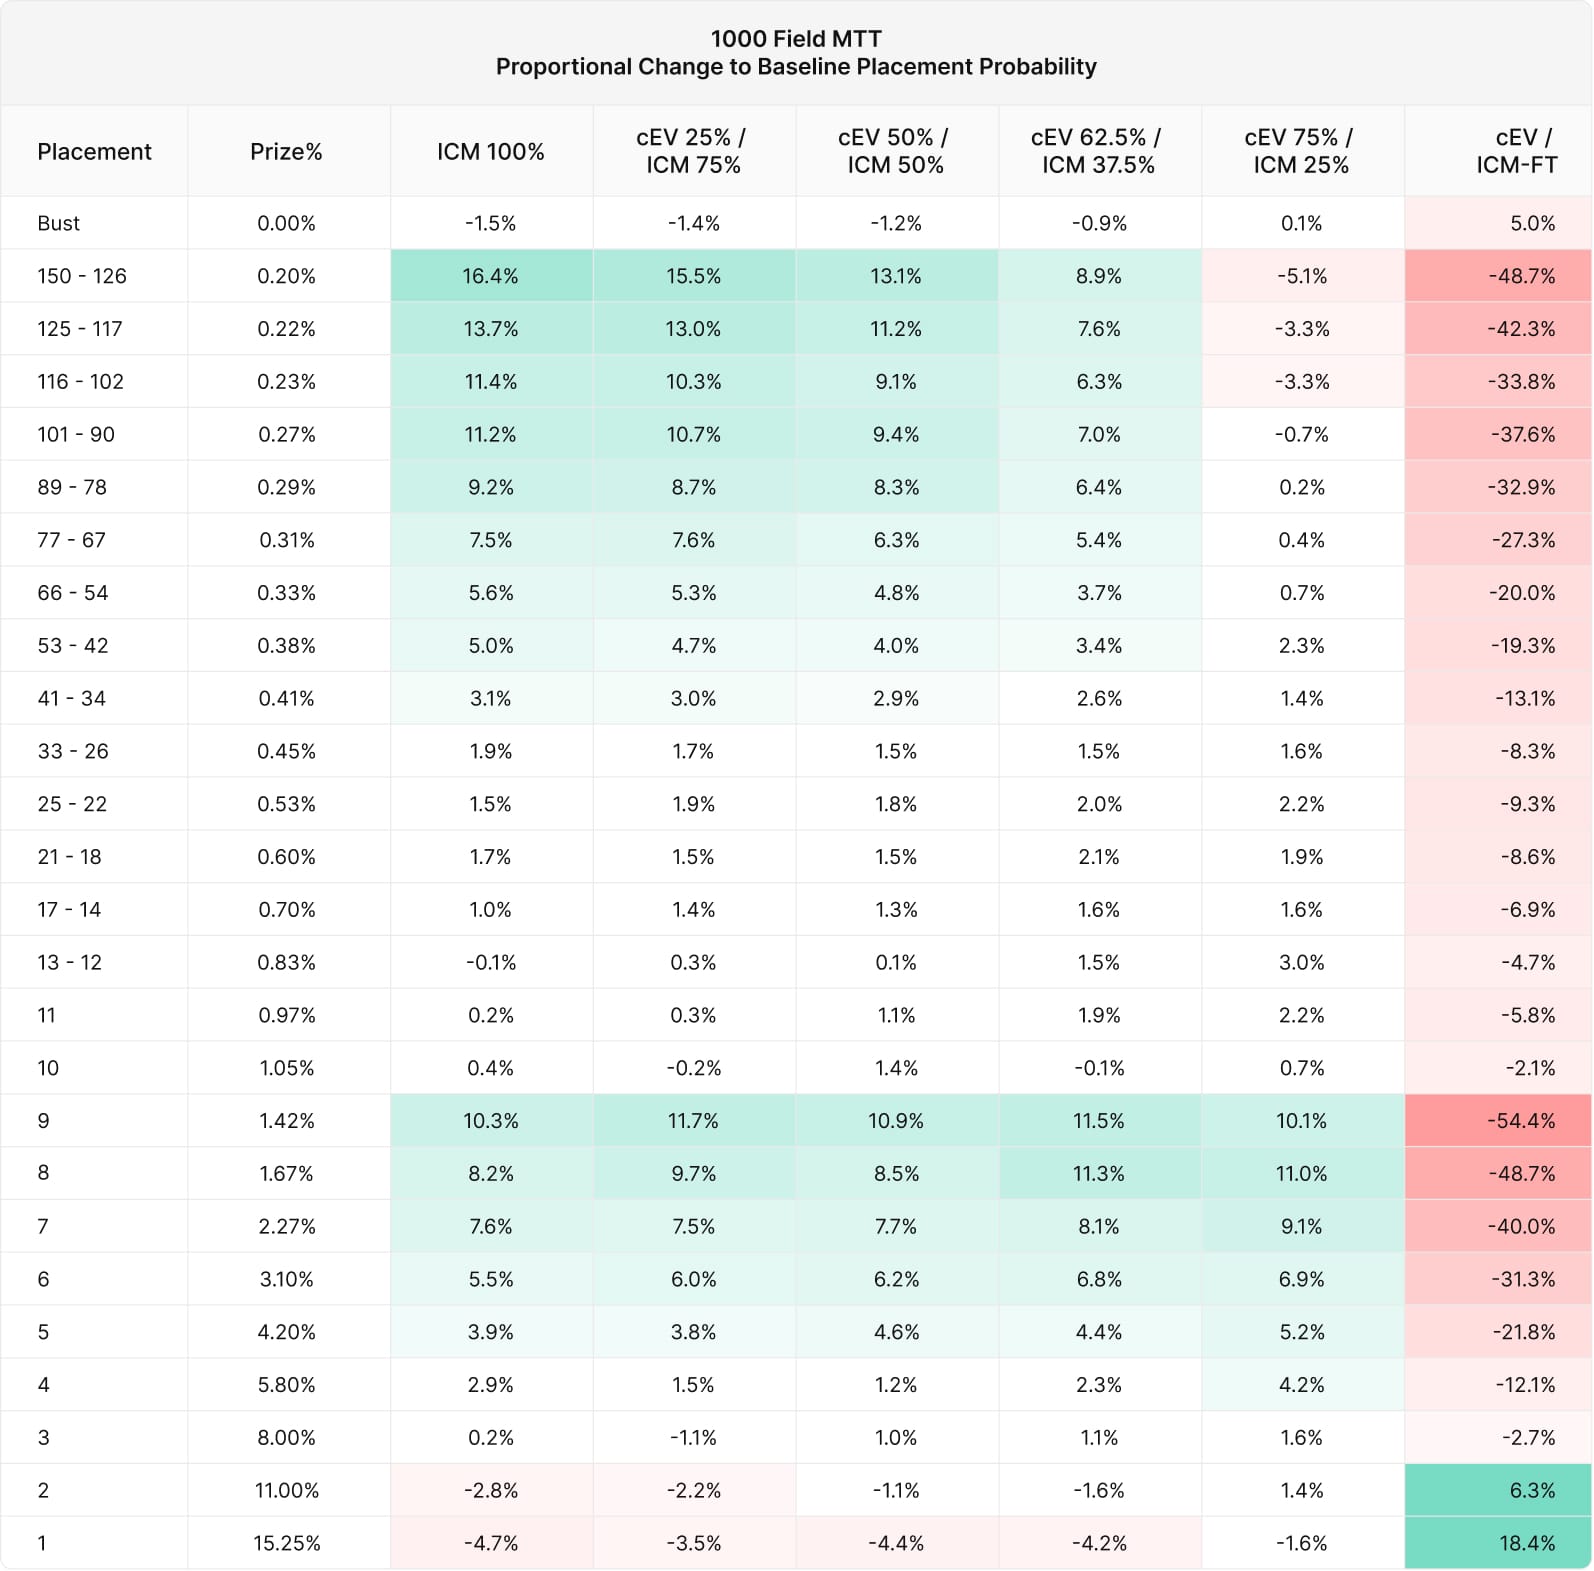
{{toggle:Proportional Change to Baseline Placement Probability}}
{{/toggle}}
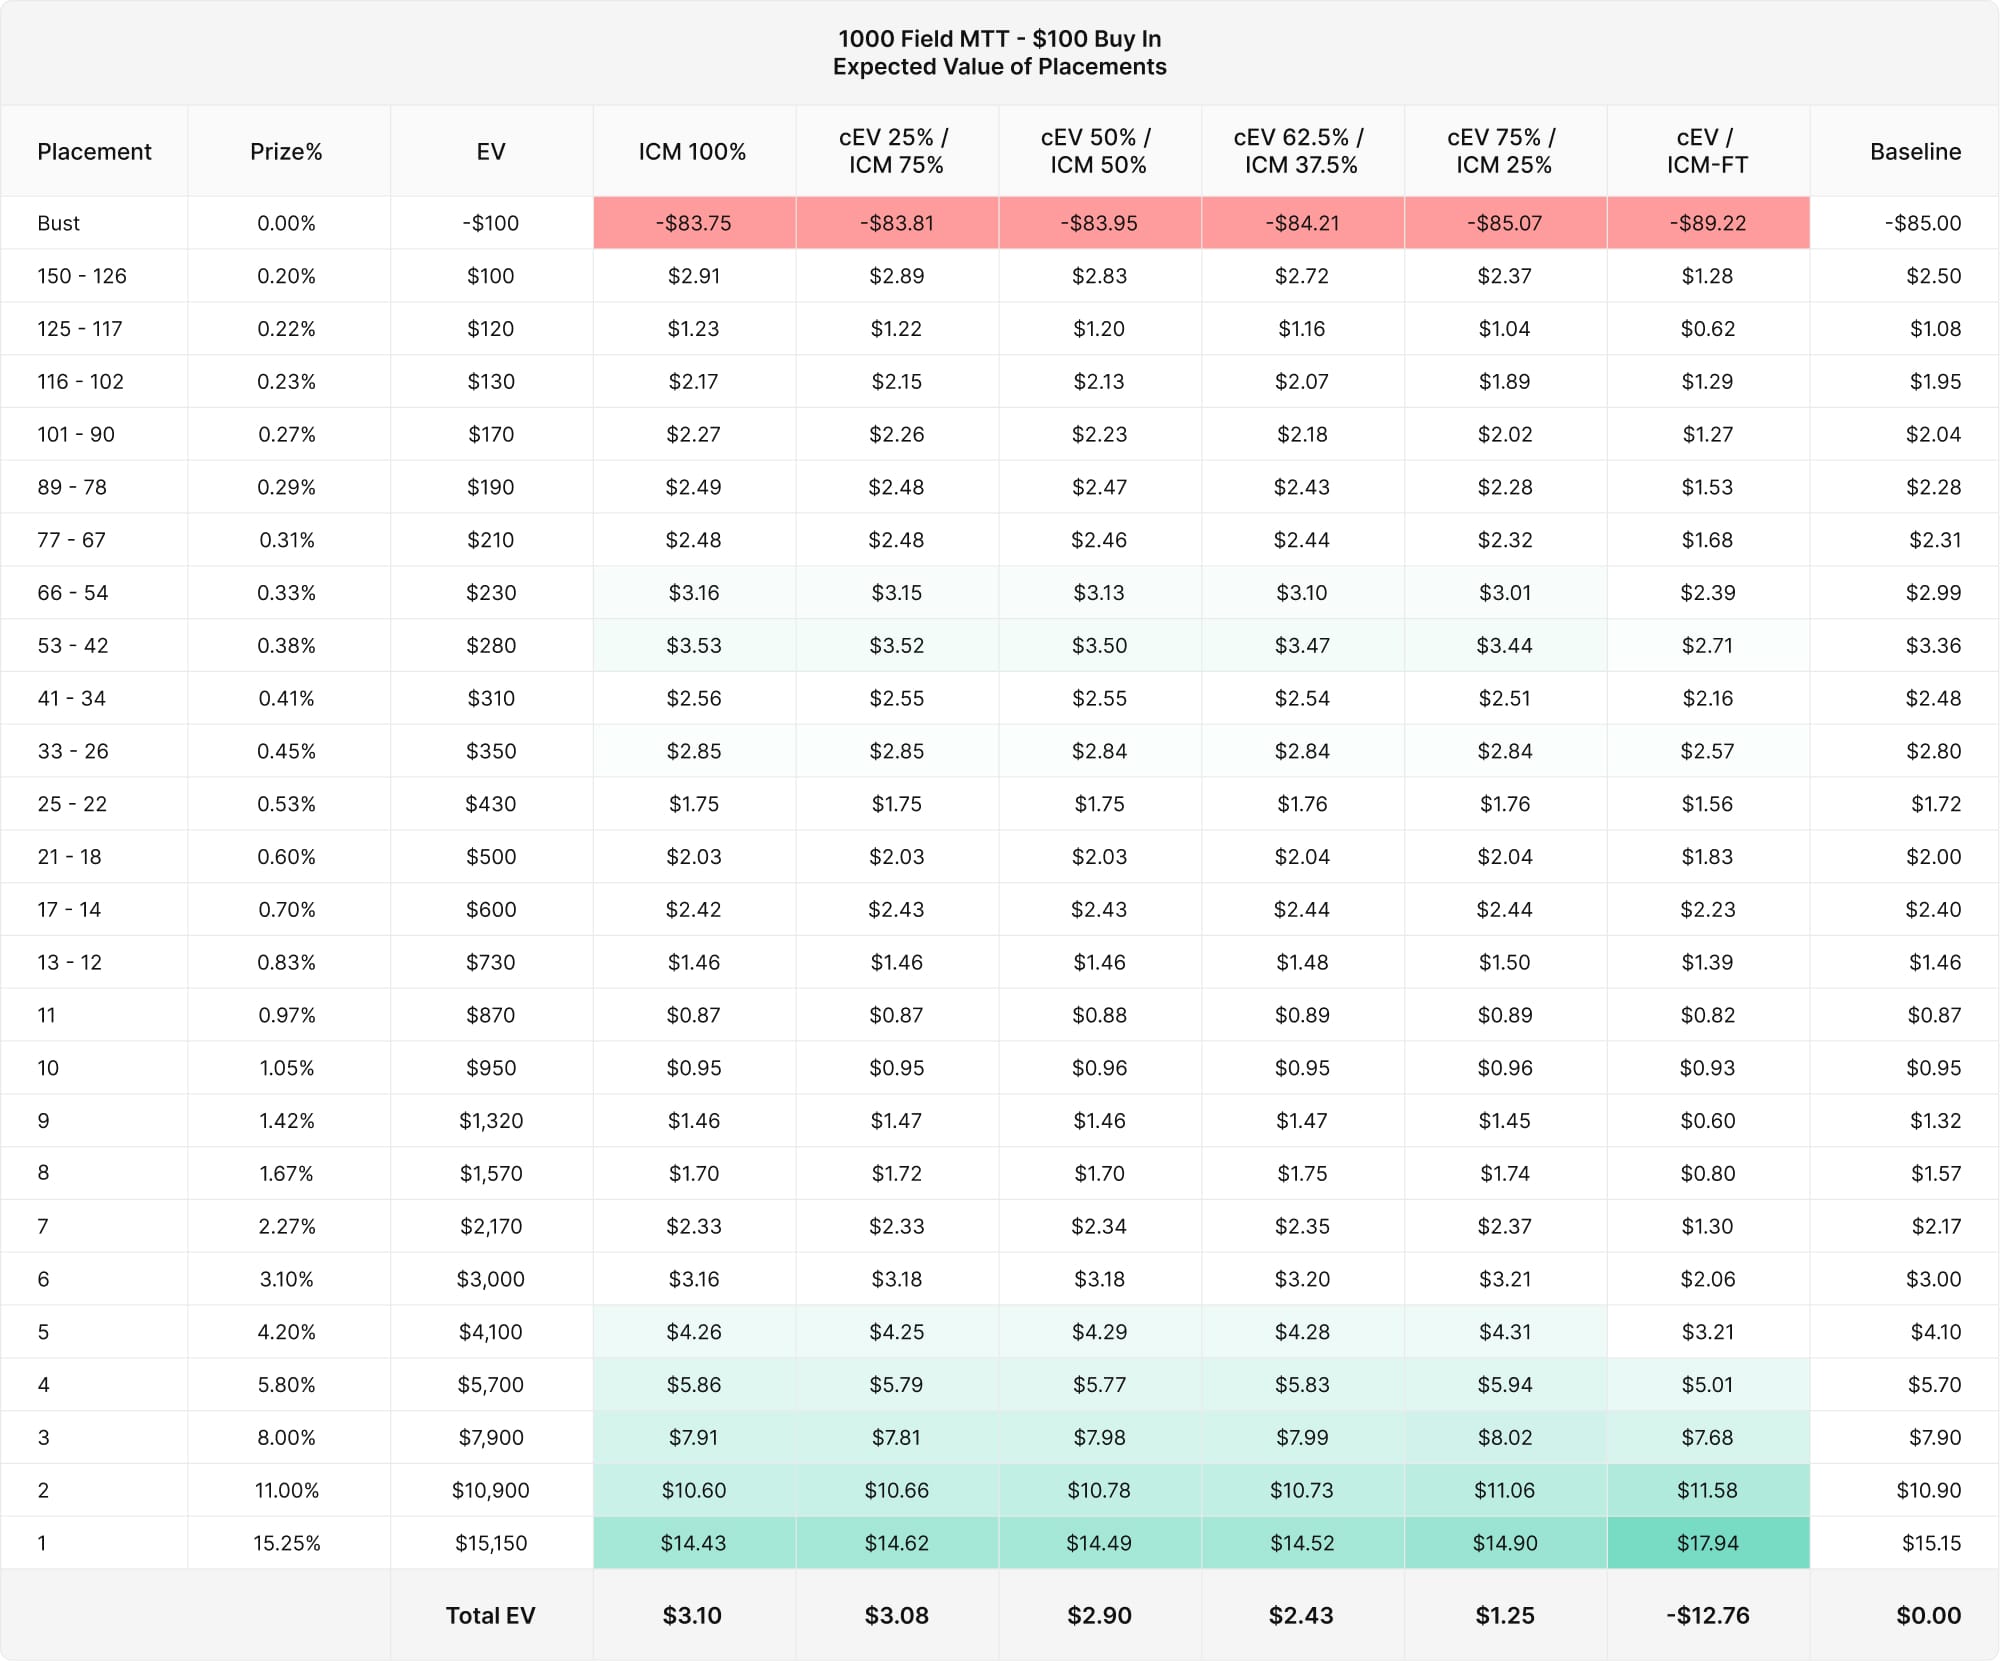
Expected Value
{{toggle:Expected value by placement}}
{{/toggle}}
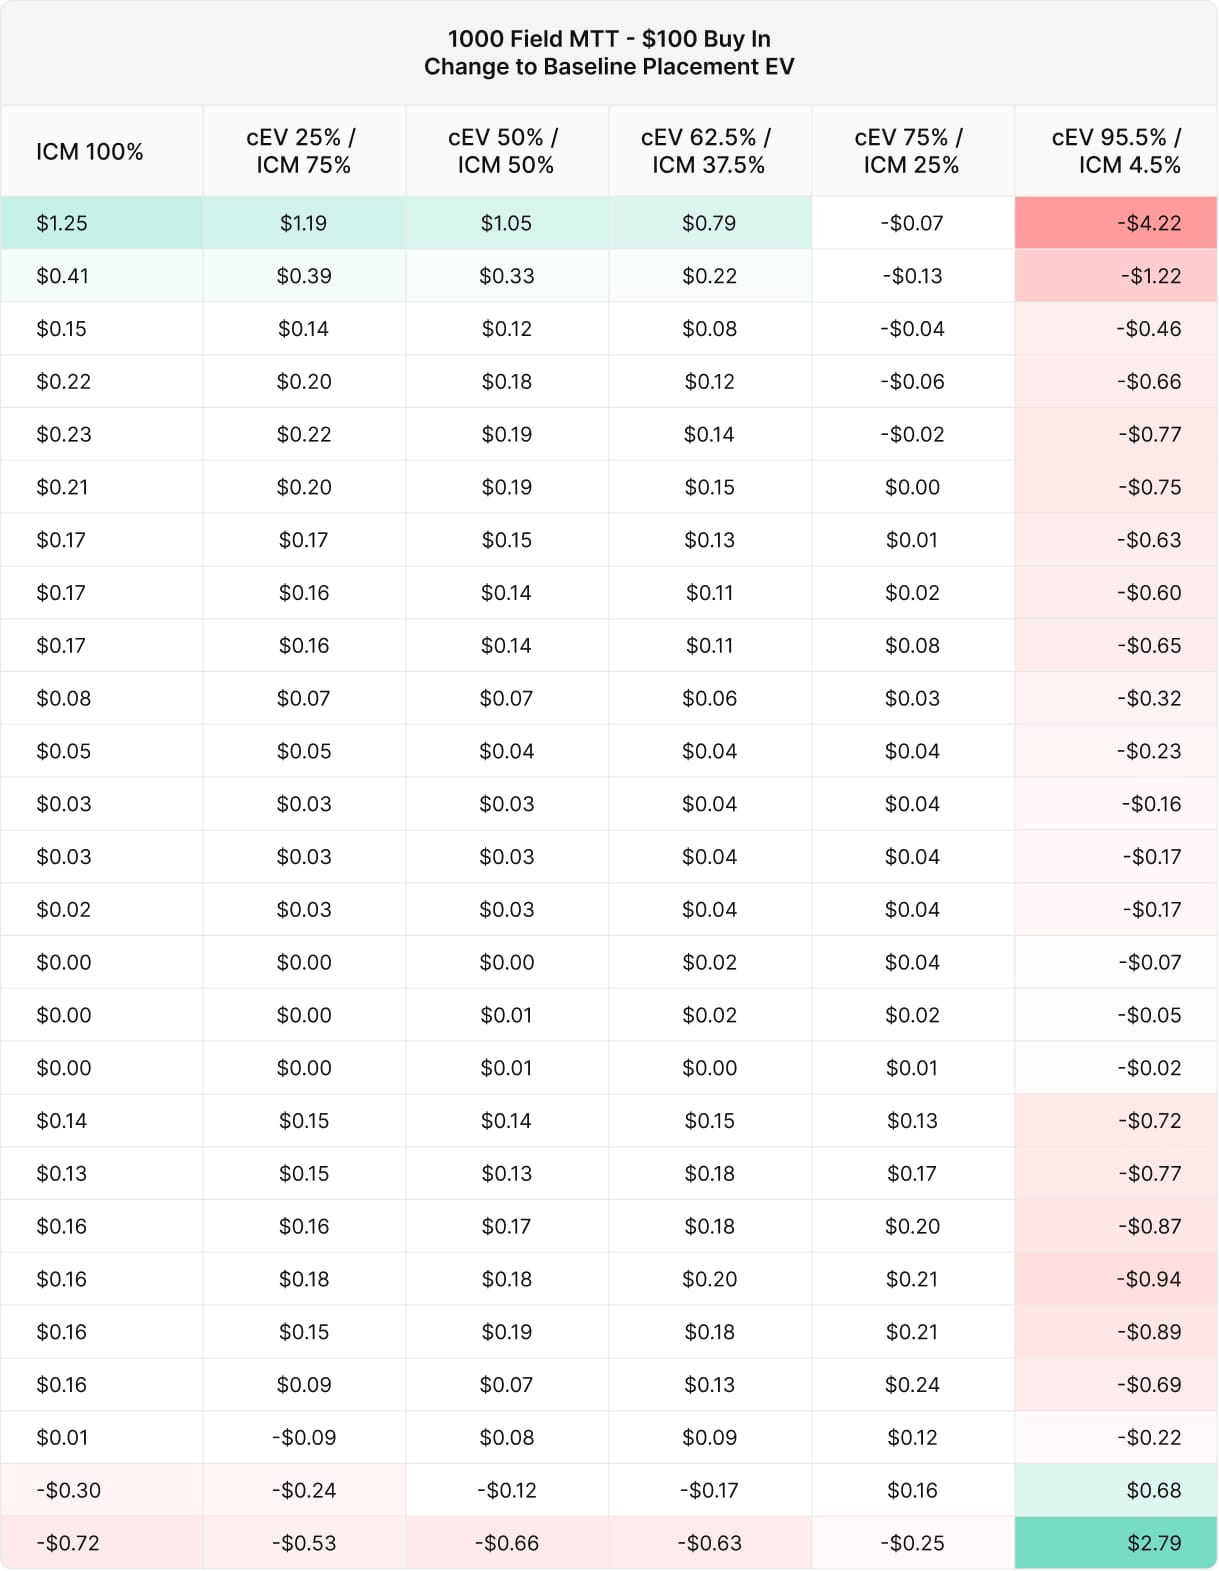
Change to Baseline Placement EV
Similar to the 200-player experiment, we see players who switch to ICM sooner placing ITM more often in exchange for slightly less EV near the very highest placements. Conversely, players who switch to ICM later tend to build bigger stacks and take on more risk, resulting in fewer ITM placements in exchange for higher EV in the highest placements.
Here we can see the change to Baseline EV of placements:
Experiment #3 – More strategies
We ran this simulation first as an exploratory sim to narrow down what contestants to use. The results serve to put the other strategies into perspective.
The Setup
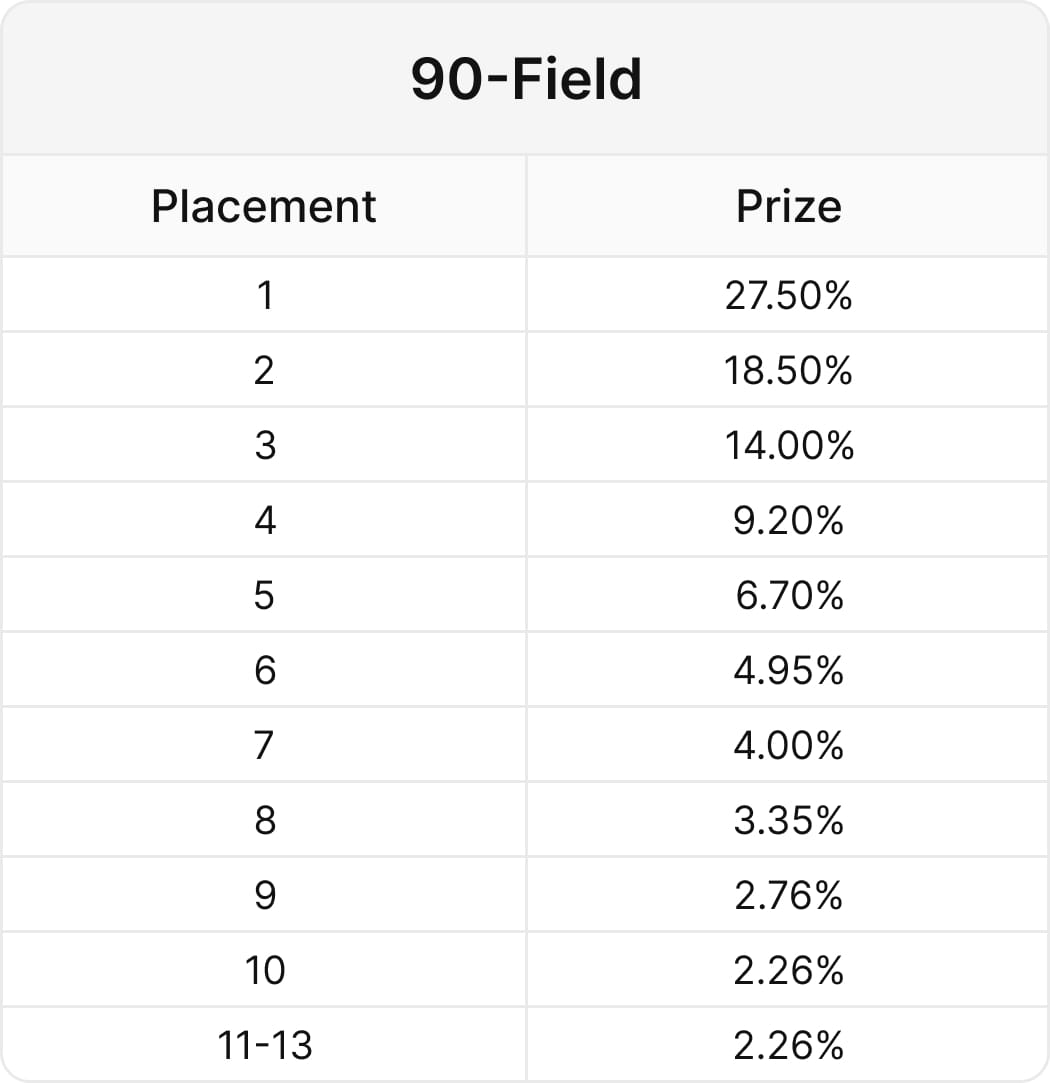
- 90-player MTT Freezeout
- 13 players paid
- Push/Fold
- BB = 1/7th average stack
- Nine different types of strategies
- Every player knows and adjusts to each other’s strategies
- Sample Size: 100,000 Tournaments
Contestants
- ICM 100%
- cEV 12.5% / ICM 87.5%
- cEV 25% / ICM 75%
- cEV 37.5% / ICM 62.5%
- cEV 50% / ICM 50%
- cEV 62.5% / ICM 37.5%
- cEV 75% / ICM 25%
- cEV 87.5% / ICM 12.5%
- cEV 100%
The Results
We see the same trend as before – players who switch to an ICM strategy sooner make more money.
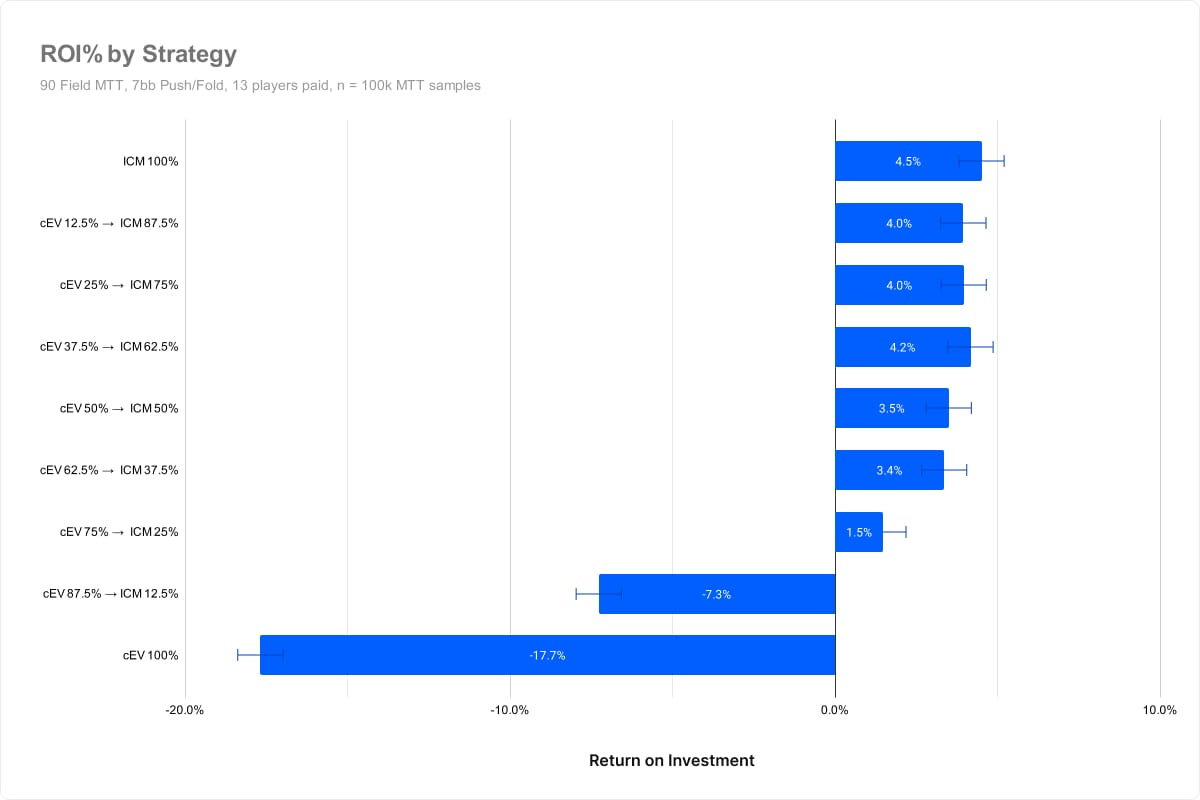
There’s some noise in these results as there are more strategically similar strategies. However the general trend remains.
It’s notable that pure chip EV is losing a lot more value, and all other players EV have increased compared to the previous experiment. This goes to show that your expected value is a function of the number of worse players in the tournament.
{{toggle:Detailed results}}
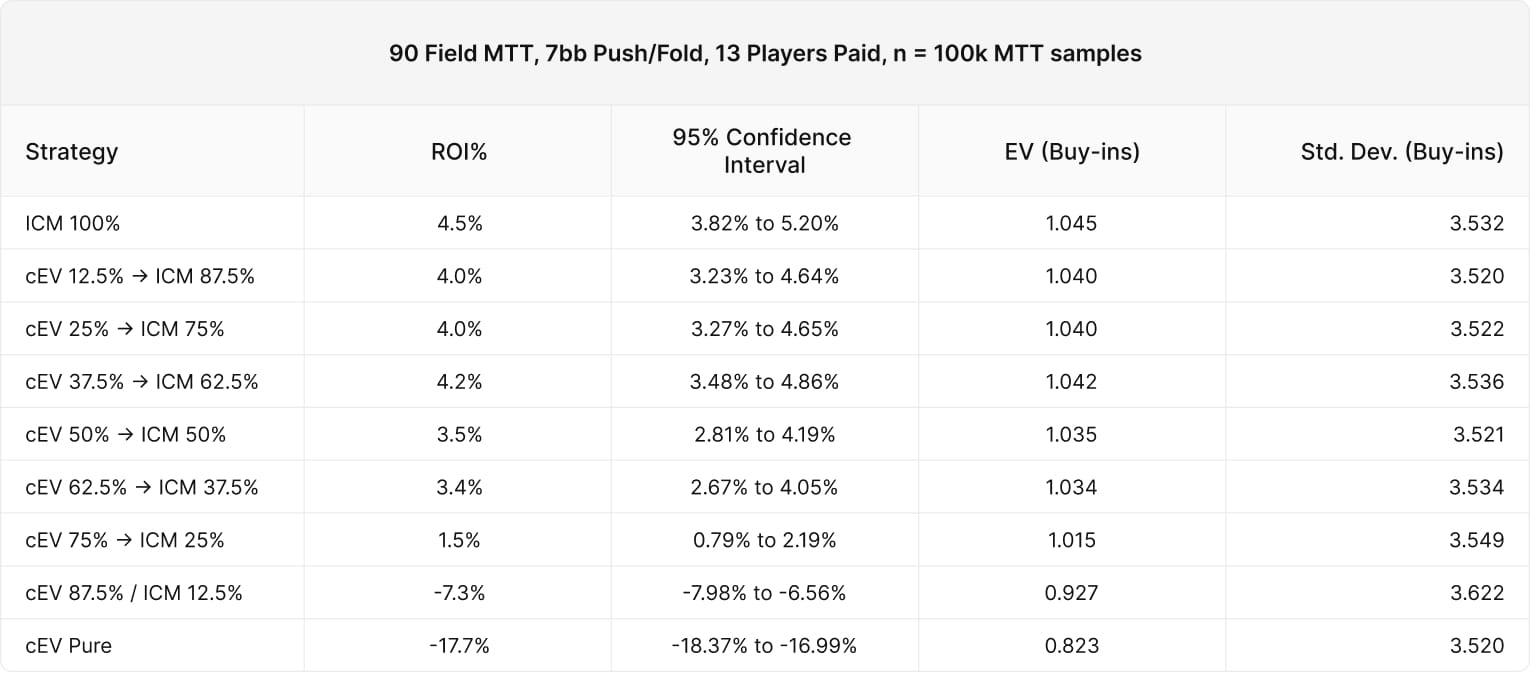
{{/toggle}}
We can say with statistical confidence that the cEV (75% / ICM 25%) strategies and below are losing value. The bubble occurs at 14.4% of the field remaining, yet players switching to ICM with 25% of the field remaining were losing. This reinforces the idea that ICM has a statistically significant impact well before the bubble. We’ll skip the EV and placement analysis in the name of brevity.
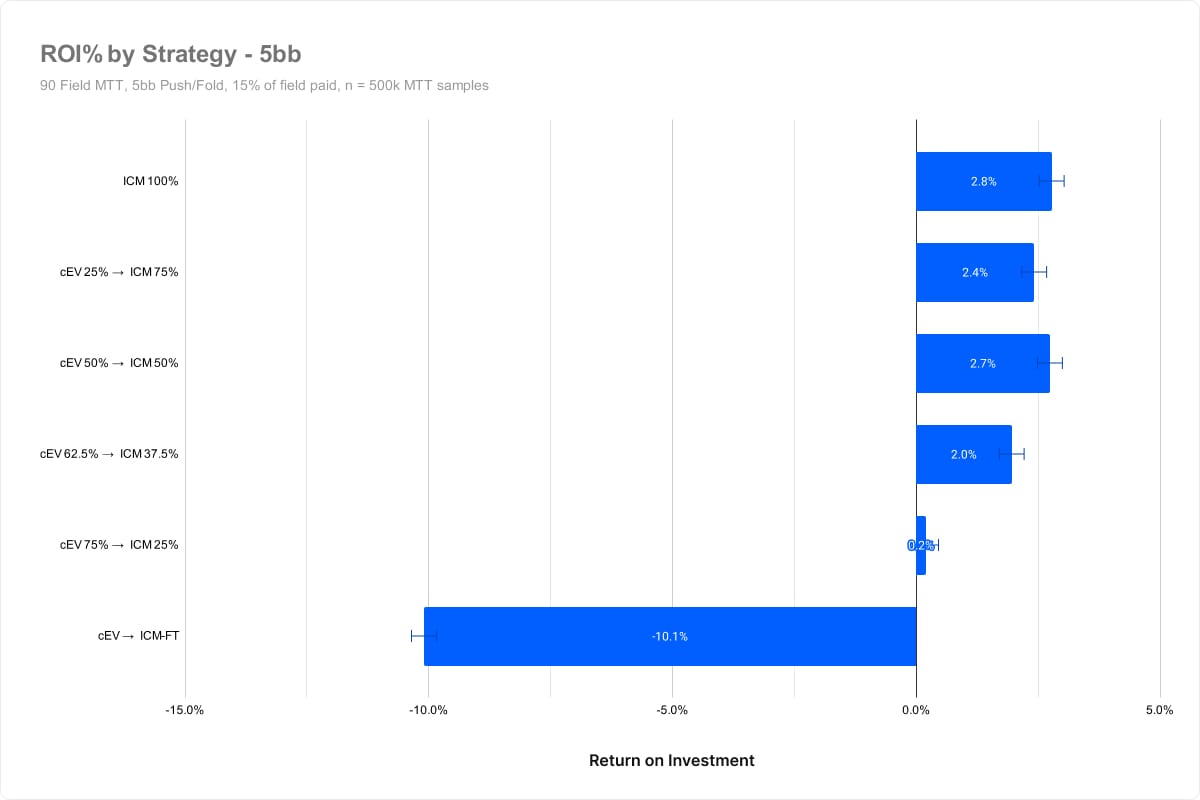
Experiment #4 – Varying stack depths
Our previous experiments have all featured a 7BB average stack depth. Next, we’ll vary the stack depth between 5BB and 10BB to see how that impacts results.
The Setup
- 90 Player MTT Freezeout
- 13 Players Paid
- We tested 5BB, 7BB, 10BB push/fold tourneys
- Six different types of strategies
- Every player knows and adjusts to each other’s strategies
- Sample Size: 500,000 Tournaments per test
5BB average stack
{{toggle:Detailed results}}

{{/toggle}}
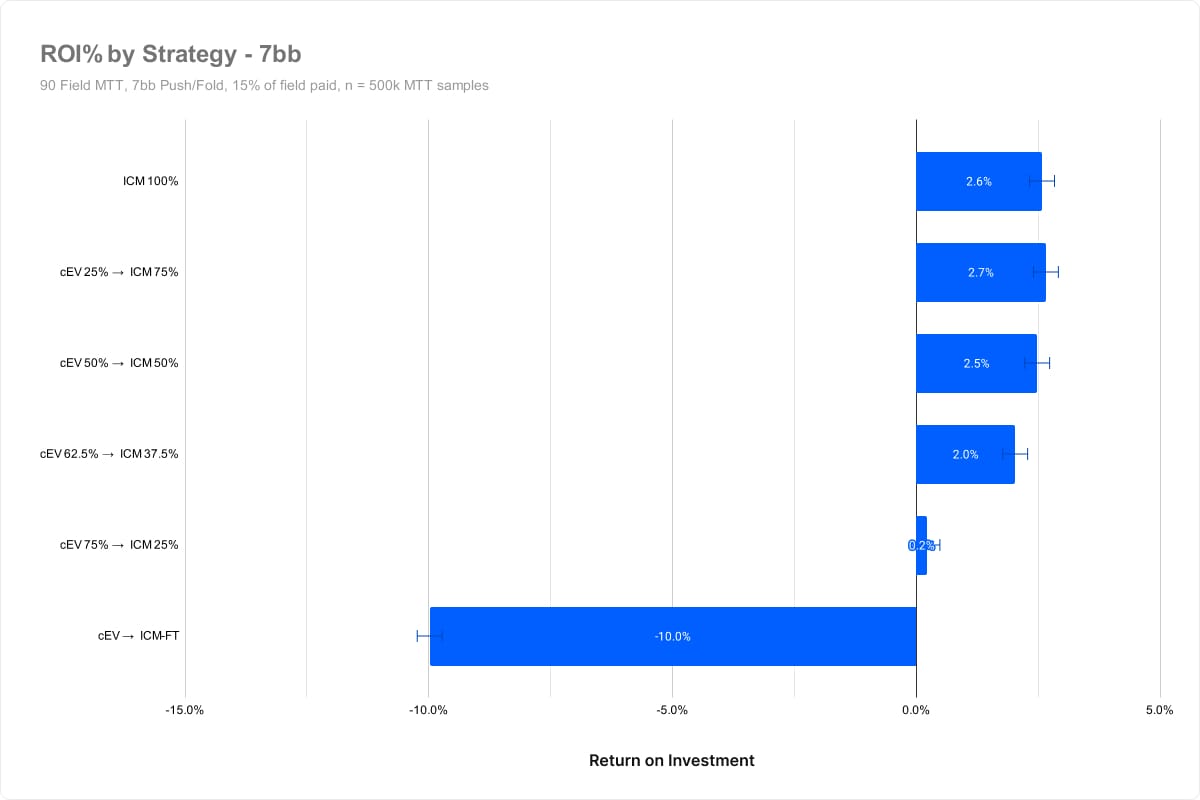
7BB average stack
{{toggle:Detailed results}}

{{/toggle}}
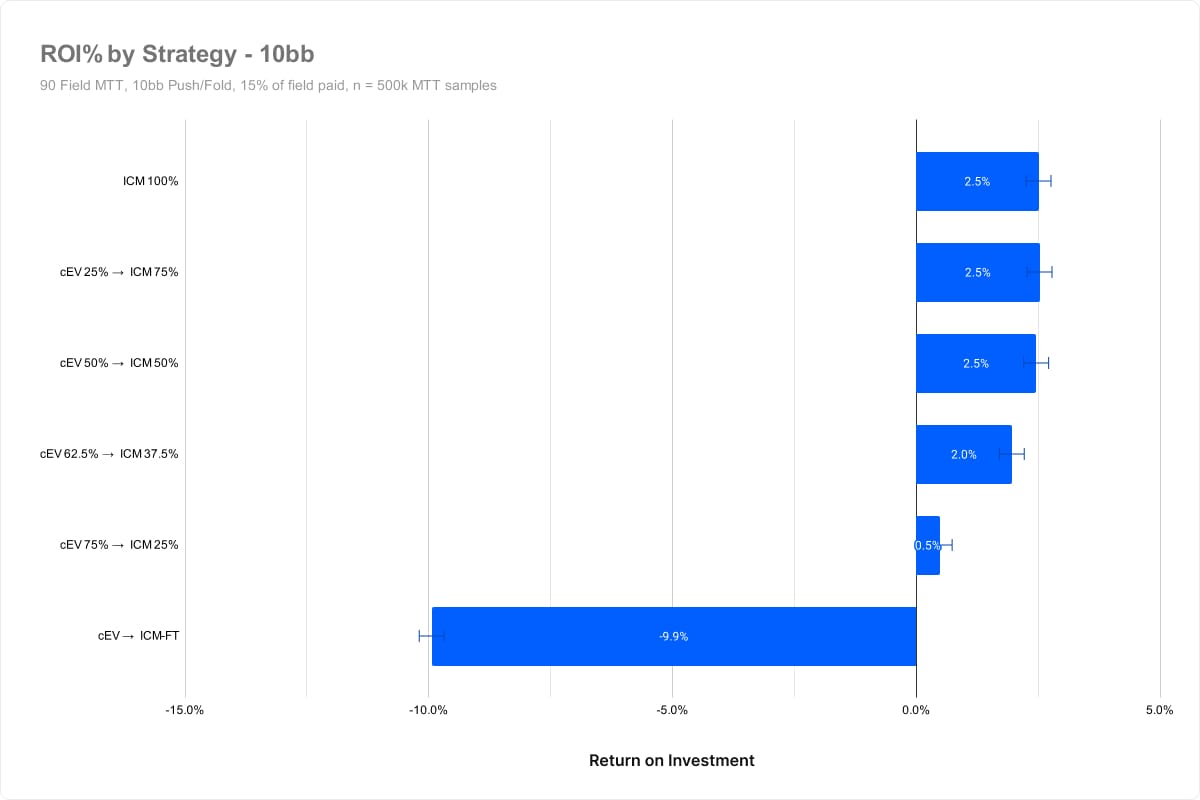
10BB average stack
{{toggle:Detailed results}}
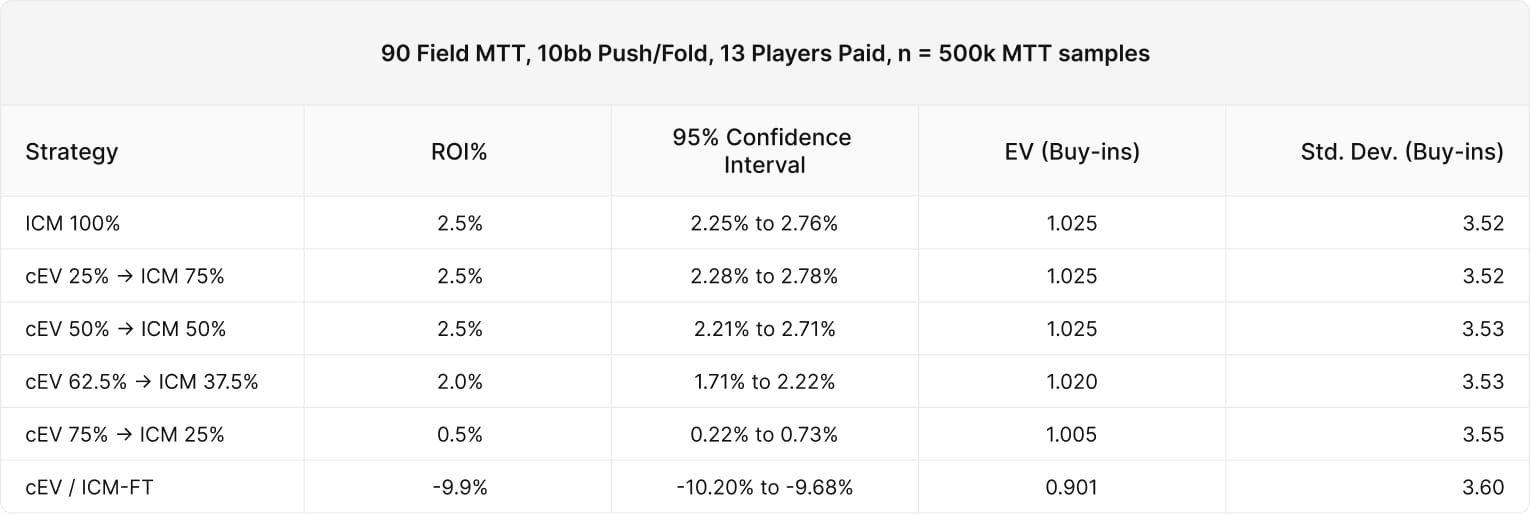
{{/toggle}}
Analysis of varying stack depths
In all cases, the (cEV 62.5% / ICM 37.5%) strategies and below performed worse with statistical significance. We can speculate that the skill edge shrinks 10BB deep due to tighter push/fold ranges. However, this might just be a variance.
Experiment #5 – Addressing a Misconception
Many players think ICM assumes the tournament stops and is paid out after the calculation. This is not the case. Estimating the value of stacks is not the same as stopping the tournament. This misconception probably stems from the fact that:
- ICM is often used to make final table deals.
- ICM doesn’t account for positional or blinds increasing next roundICM makes no assumptions about strategy, it has no idea who has a position, or what the word “range” means. All ICM does is estimate stack placement probabilities. In this experiment, we’ll demonstrate that ICM works even if no player is aware of the concept!
The Setup
This time, we’ll simulate two player groups, half-stack players and full-stack players.Every player uses a chip EV strategy, so no one in this simulation cares about ICM.
- Two player groups, one with half-stack and one with full-stacks
- Everyone plays chipEV strategies
- BB = 1/7 average stack
- 200 Field MTT, 15% of field paid (same payout structure as exp #1)
- Push/Fold
- $100 buy-in
- Sample Size: 250,000 TournamentsThe Results
Here we see the simulated result of half and full stack players compared to how ICM predicts they’ll do. For example, “Top 15%” means how often one player will place in the top 15% of the tournament. “Top 50%” means how often one player finishes in the top 50% of the tournament. ICM predicts the half-stacked group to have a tournament value of $67.74, and the full-stacked group to have a tournament value of $132.26.
Let’s see how close these predictions are to the simulated results:
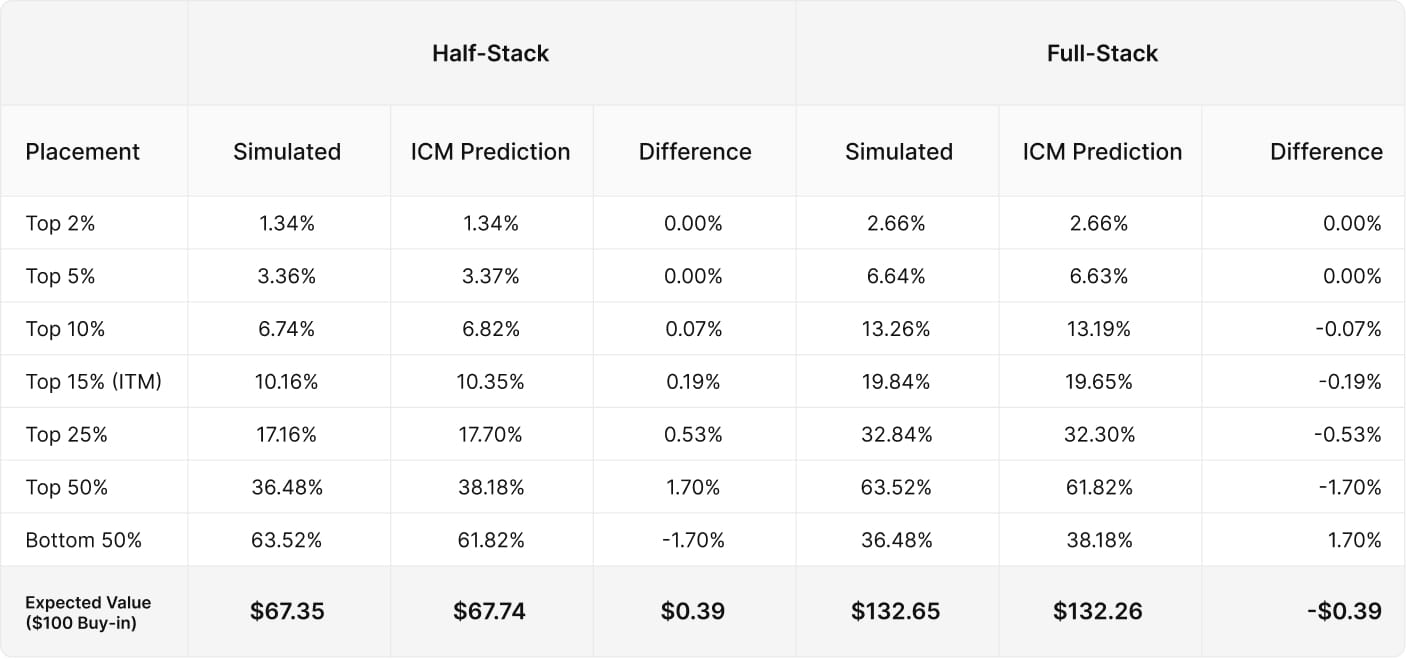
ICM predicts each player’s EV with only a $0.39 difference between the estimated and simulated results. These results indicate that the independent chip model is a valuable and accurate predictor of tournament equity, regardless of whether or not players in a tournament are aware of the concept. The results also demonstrate that ICM is most accurate where it matters – it has much stronger predictive powers near the top where the money is.
How this impacts your strategy
The purpose of these experiments is to find out when ICM becomes significant. We can demonstrate in GTO Wizard that strategies change significantly, even at the halfway point in a tournament.
You can use the GTO Wizard to gain an edge over your competition by studying ICM strategies for early and mid-stage MTTs.
The following gifs show how your strategy changes throughout a tournament. This is based on a 200-player payout structure as outlined in Exp #1.
Example 1: LJ RFI
Here we see the optimal LJ opening strategy 20BB deep. To make comparisons easier, all players are assigned symmetrical 20BB stacks. The frequency doesn’t change too much, but the shape of the range changes dramatically.
Note how blocker-heavy the opening range becomes as you progress through the MTT. As risk premium increases, more of your EV is derived from stealing the blinds rather than postflop play. Postflop implied odds decrease due to tightened stack-off conditions and higher risk premium. As a result, drawing hands are traded out for hands that block 3bets instead.
Example 2: BB Defence
The effects of ICM are most obvious in the big blind. This is another 20BB symmetrical stack spot. Look how much tighter BB becomes facing the LJ open as the tournament progresses!
Even halfway through the tournament, BB’s folding frequency changes from 19.6% to 35.5%. Most hands in BB’s range are close to breakeven, so small changes to risk premium have a big impact on their defense.
Example 3: LJ facing BTN 3bet
LJ opens, BTN 3bets, actionon LJ. Here we see LJ’s strategy change throughout the MTT.
Note how LJ’s calling frequency decreases as the tournament progresses. Instead, LJ opts for shove/fold strategies, playing “ICM chicken” against the BTN. Clearly, ICM has significant impacts on your strategy pre and postflop. Looking at these strategic changes in the GTO Wizard leads me to believe our push/fold experiments do not capture the full extent of ICM’s advantage in mid-stage MTT spots.
Alternatives to ICM
It should be noted that ICM is an imperfect model. It’s possible to brute force more precise tournament evaluations, but only for very small game trees. 📰 This excellent paper by Helmuth Melcher (the founder of Holdem Resources Calculator) compared traditional ICM to alternative models. Three tournament equity models were pitted against an exact NE strategy (denoted PI-CFR+) and also against each other. The original ICM method is denoted as “Harville”, or sometimes “Malmuth-Harville” after its inventor(s).
Simulation Results
The tables in the following sections show the simulation results for one player using the single hand equilibrium strategies based on a specified equity model, simulated against the other player using the PI-CFR+ strategies.
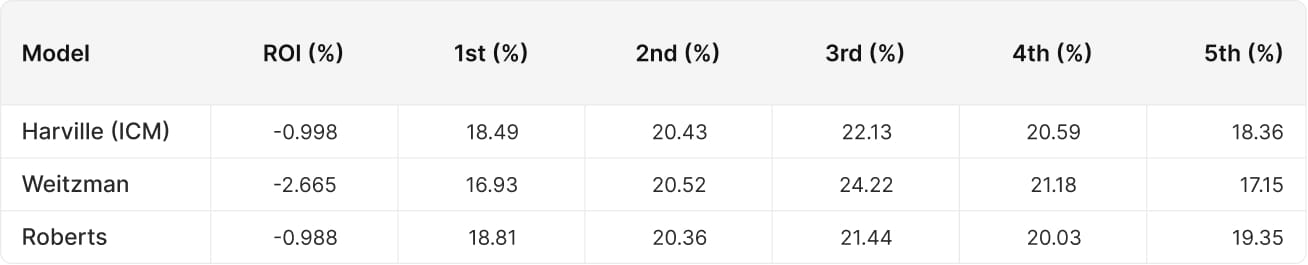
Harville (ICM) and Robert’s formula both did extremely well, losing only 1% of their buy-in against a perfect strategy. It should be noted that Roberts loses less against the exact strategy, but Harville (ICM) beats Robert’s formula when the two are pitted against each other.
The reason we prefer ICM is that it’s more efficient. The original ICM calculation can be scaled to instantly evaluate thousands of players! 💯
ICM has some general limitations, which we’ve outlined here. The main weaknesses of ICM are that it ignores things like the blinds increasing next round, positions rotating (unless you use FGS), skill edge, and position. Generally, ICM tends to underestimate chip leader advantage. But overall it’s an extremely strong formula, even 35 years after its conception.
Conclusions
The purpose of these experiments was to find out at what point ICM becomes a significant factor in MTTs ⚖ To test this, we simulated millions of MTTs with contestants that would switch from chip EV models to ICM models at different points throughout the tournament.
- We tested multiple tournament structures and field sizes
- We tested multiple stack depths
- We demonstrated ICM’s predictive powers even when no player was using ICM
- We showed how significantly solver strategies change even halfway through an MTT
Our results consistently found that players who switched to ICM sooner outperformed players who switched to ICM later
Strategies that switched to ICM before the halfway mark saw a consistent increase in return, but the gain was relatively small and within the margin of error. We showed with high confidence that ICM has a statistically significant impact on results somewhere between 50% and 37% of the field remaining for a 15% payout structure. We can speculate that the “sweet spot” for switching to ICM occurs at roughly three times the bubble. It should be clear by now that ICM has a significant impact on strategy well before the bubble.
Holdem Resources Calculator
We would like to express our gratitude to Helmuth Melcher, the founder of Holdem Resources Calculator (HRC), for conducting these simulations and providing guidance during this experiment.

How Payout Structures Reshape Postflop Strategy
Is all ICM pressure the same, or should we tailor our postflop strategy to different payout structures? How big of an error is it to take the same default final table strategy into a tournament that features a more top-heavy or a more flat payout distribution?

How ICM Quietly Shapes Postflop Strategy From the Start
How significant is ICM at the start—as in the very first hand—of a tournament? Have we been learning the wrong way all this time by using Chip EV ranges to study spots when stacks are deep and few players have been eliminated?

ICM vs. ChipEV: The Hidden Logic Behind BB 3-Bets
BB 3-betting is fundamentally different from 3-betting from any other seat, even the SB. Calling at a discount and closing the action is such an appealing option that many hands that may seem like “natural” 3-bet candidates have higher EV as calls. This is even more compelling when taking ICM into a