Dynamic Sizing Benchmarks


Overview
Update: We have improved the dynamic sizing algorithm to deliver more accurate and consistent strategies. Note that these benchmarks were run for the earlier iteration of the dynamic sizing algorithm. See the updated benchmarks here!
Dynamic Sizing is a revolutionary new poker algorithm that automatically simplifies your strategy with the highest {{tooltip-title: EV}} bet size(s) at each decision point!
Dynamic Sizing uses a machine learning algorithm (learn more in this article) to estimate optimal sizing. This begs the question—how accurate is this algorithm? How often does it find the best sizing, and how do we measure its performance? We ran extensive benchmarks to find out!
{{tooltip-content: EV}}
Expected Value (EV)
The anticipated value one expects from any hand, position, or play. EV is calculated as a weighted average of all possible outcomes weighed by the probability of each of those outcomes.
{{/tooltip-content}}
{{toggle: Table of Contents}}
- Performance Summary
- Methodology
- Dynamic Performance: Compared To Complex Strategy
- Dynamic Performance: Compared To Single-Size Strategy
- What Is the Optimal River Size?
- Benchmarks Against Slumbot
- Conclusion
{{/toggle}}
Performance Summary
- Dynamic Sizing captures 99.95% of the available river EV compared to the optimal one-size betting strategy.
- Dynamic Sizing finds a near-optimal (less than 0.25% EV loss) bet sizing 95% of the time.
- Dynamic Sizing outperforms any fixed sizing strategy.
- Dynamic Sizing captures 99.7% of the available river EV compared to playing a very complicated strategy.
- Dynamic Sizing outperforms more complex strategies in practice when time/convergence is a factor.
- Dynamic strategies are easier to study, easier to implement, and less noisy than complex strategies.
All tests were done on the river, where we anticipate the largest EV losses from simplifying. The Dynamic Sizing algorithm should perform even better on earlier streets!
Methodology
We simulated hundreds of 100bb heads-up hands using self-play and benchmarked the accuracy of 500 river spots. The benefit of using self-play to sample rivers is that more common spots are more heavily represented in the data.
{{grid: 3fr 1fr}}
To gauge performance, we started by measuring the expected value (EV) of playing a complex strategy where both players have 8 bet sizes and 5 raise sizes. Then, we gave one player a simplified one-size strategy, re-solved and measured the EV loss. We repeated this process separately for both positions. Rivers were solved using CFR to an accuracy of 0.05% pot. Donk-bet spots were excluded from the OOP calculations.

{{/grid}}
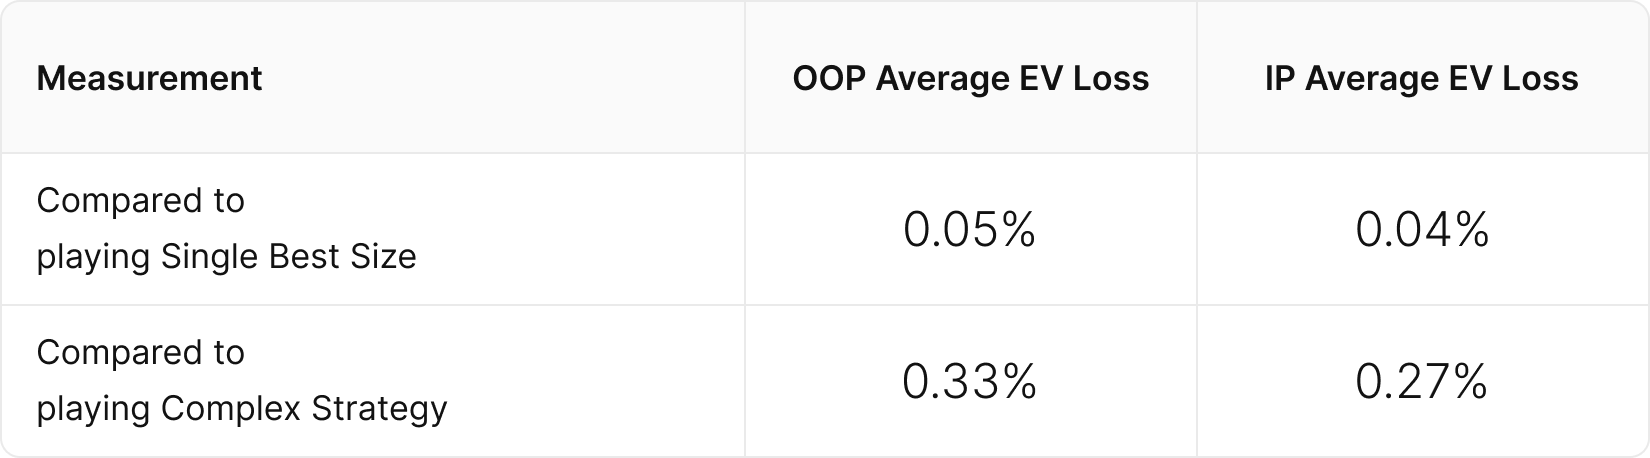
The Dynamic Sizing Algorithm averages an EV loss of only 0.05% pot on the river as compared to the single best size strategy. It averages an EV loss of only 0.30% compared to playing a complex river strategy with 8 different sizes, outperforming any fixed single-size strategy!
- Single Best Size represents performance relative to playing the best one-size strategy.
- Complex Strategy represents performance relative to playing a complex strategy with 8 bet sizes.
- In all cases, Hero is playing against a complex exploitative opponent, doing everything in their power to punish our simplification.
Dynamic Performance: Compared to Complex Strategy
Our first test involved seeing how well a single-size dynamic strategy performed compared to playing a more complex strategy. Keep in mind simplifying 8 sizes down to 1 will always carry some theoretical EV loss, even if you always choose the best size.
The following chart displays how often (vertical ⇅) the Dynamic Algorithm achieves different EV losses (horizontal ⇆) as compared to playing a more complex strategy:
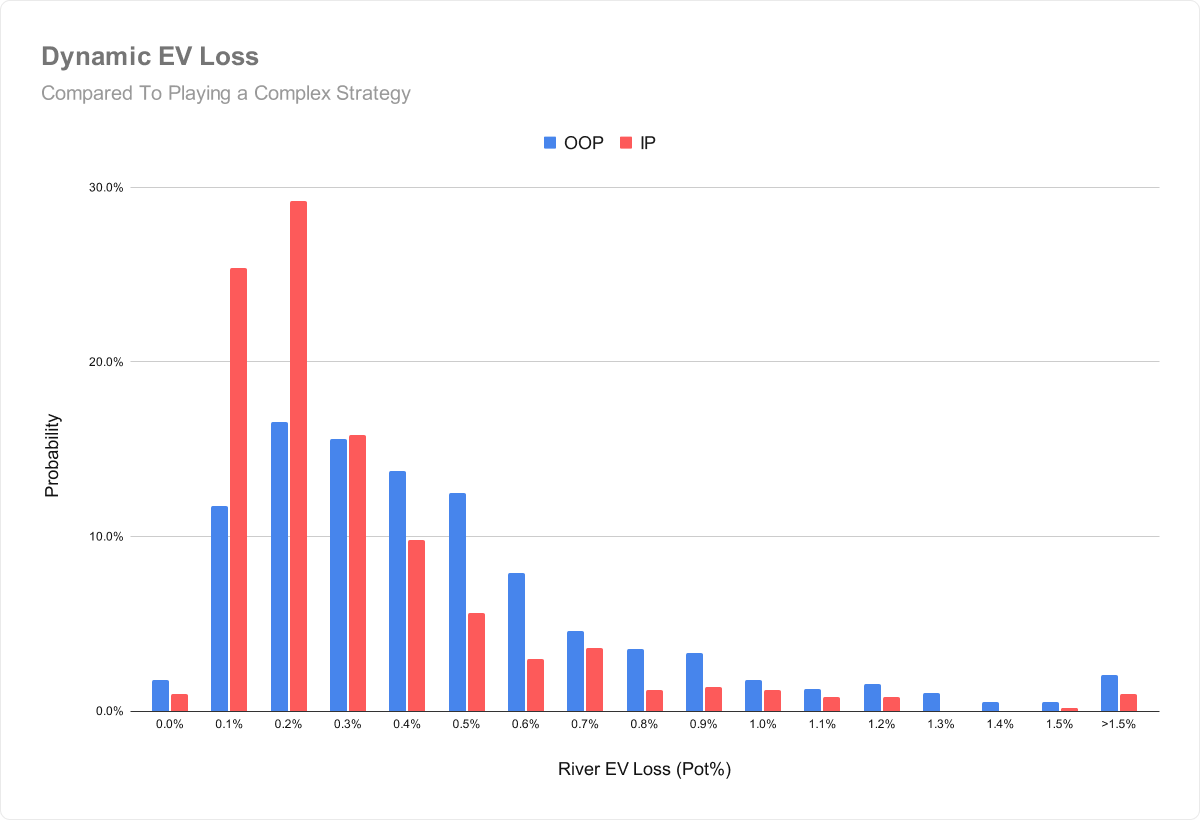
We were happy to find that a Dynamic single-size strategy captures, on average, 99.7% of the river EV. EV Losses are most often in the range of 0.1% – 0.5% pot, very rarely exceeding 1% of the pot.
Dynamic Performance: Compared to Single-Size Strategy
The fairest performance test involves measuring EV loss relative to the best single size we could have chosen.
The following chart displays how often (vertical ⇅) the Dynamic Algorithm achieves different EV losses (horizontal ⇆) compared to playing the optimal single-size strategy.
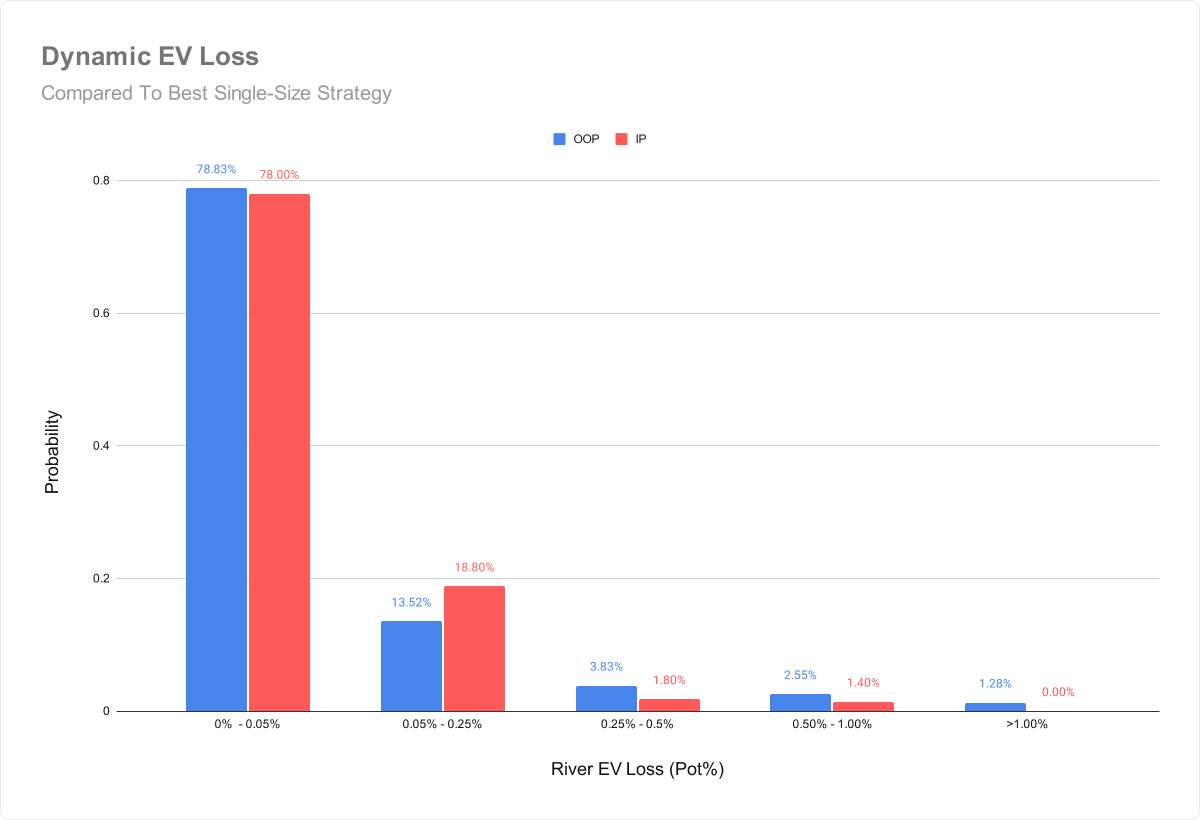
The Dynamic Algorithm managed to choose the optimal river bet size 78% of the time, and chose a near-optimal bet size that lost less than 0.25% EV about 95% of the time.
Dynamic sizing has more variability in spots where many sizes yield similar payoffs. There are other scenarios where one size is clearly preferred, and that’s where Dynamic Sizing is most likely to choose the optimal bet size.
What is the Optimal River Size?
{{question-mark}}
If you were to simplify your betting strategy on the river down to one size, what size would perform best?
{{/question-mark}}
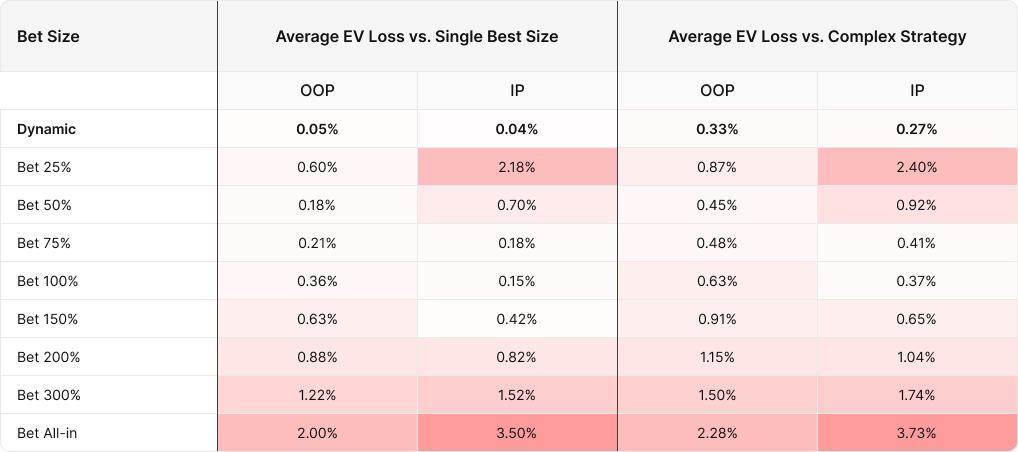
We measured the EV loss of playing a one-size-fits-all river strategy. Again, this is measured relative to playing a complex exploitative opponent doing everything in their power to punish our simplification. The following interactive chart displays EV losses of using one fixed bet size on the river. You can filter by position!
Each data point here represents the EV loss of using just that one bet size or check on the river. For example, bet 100% means we measured the EV loss of using just a pot-sized bet or check on the river. The optimal fixed river bet size seems to be about 75%-100% pot in position (IP), and around 50% pot out of position (OOP). We were surprised to see that fixed size EV losses were relatively low compared to playing a complex 8-size strategy. This data suggests you can get a fairly strong fixed bet sizing strategy on the river just playing 50% OOP and 75% pot IP.
This opens up some interesting theoretical questions about why OOP prefers smaller bet sizes than IP. One explanation is that IP reopens the action when they bet, meaning they should use a more polarized strategy with larger sizes. OOP, on the other hand, doesn’t reopen the action, has more incentive to block-bet, and can even value bet with hands that are slightly behind when called due to the EV of checking being lower. But this is a discussion for another article!
Benchmarks Against Slumbot
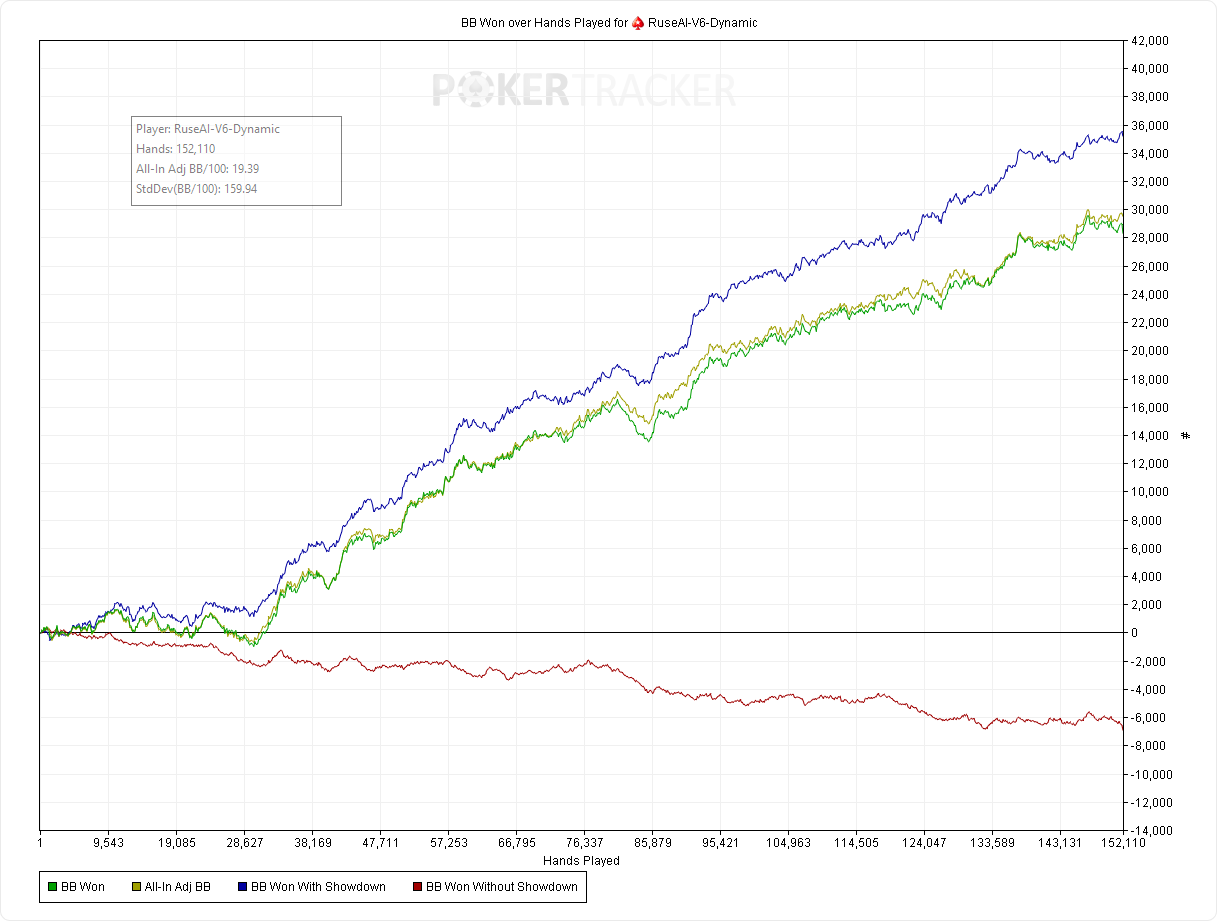
We were thrilled to find that when battling vs. Slumbot, the highest performing 150,000 hand trial was the one using 1-size dynamic sizing, meaning that we only used one bet size per node. Theoretically, a complex strategy should outperform a simple strategy, but the 7-second move limit allowed the simpler approach to reach higher accuracy.
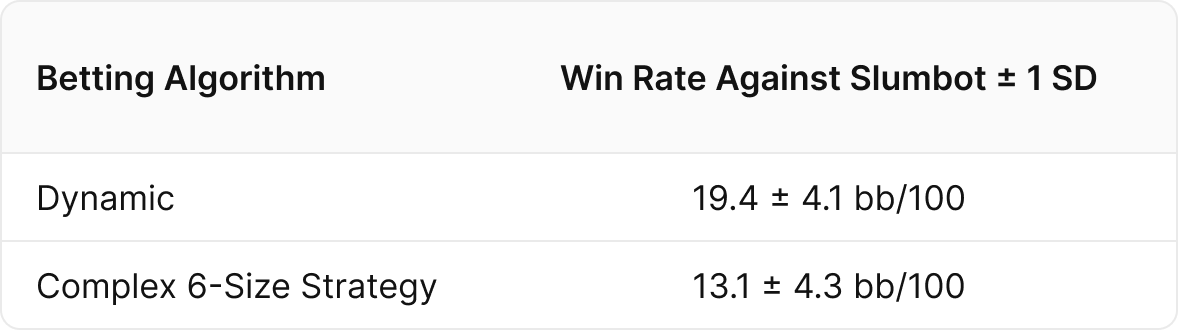
Here you can view the graphs of both matches against Slumbot. In both cases, Ruse (now GTO Wizard AI), outperformed Slumbot significantly, however the Dynamic algorithm had a 50% higher win rate and experienced less variance during the match.
Complex Strategy vs Slumbot:
- Win rate: 13.1 bb/100
- 70% confidence interval: 8.8 to 17.3 bb/100
- 95% confidence interval: 4.5 to 21.6 bb/100
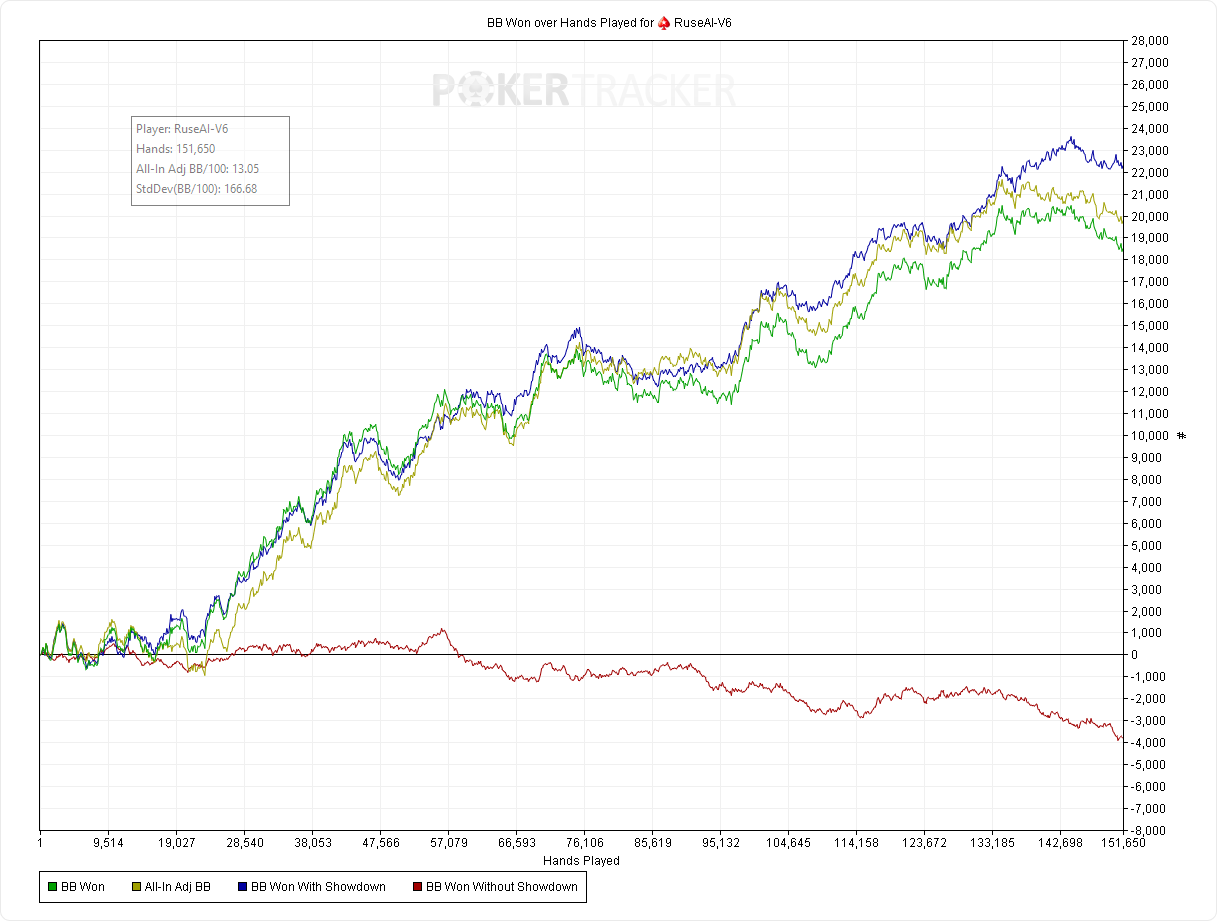
Dynamic Strategy vs. Slumbot:
- Win rate: 19.4 bb/100
- 70% confidence interval: 15.3 to 23.5 bb/100
- 95% confidence interval: 11.2 to 27.6 bb/100
Conclusion
{{grid: 3fr 1fr}}
Poker players sometimes fear that they will lose EV by simplifying their strategy, but we can confidently say from experience that the opposite is true. Rest assured that simplified strategies improve your learning experience and win rate. You will find improvements to both your accuracy and your confidence as you start to cut away unnecessary complications from your game and focus on what matters most.
To recap the benchmarks:

{{/grid}}
- Dynamic Sizing captures 99.95% of the available river EV compared to the optimal one-size betting strategy.
- Dynamic Sizing finds a near-optimal (less than 0.25% EV loss) bet sizing 95% of the time.
- Dynamic Sizing outperforms any fixed sizing strategy.
- Dynamic Sizing captures 99.7% of the available EV as compared to playing a very complicated strategy.
- Dynamic Sizing outperforms more complex strategies in practice when time/convergence is a factor.
- Dynamic strategies are easier to study, easier to implement, and less noisy than complex strategies.
All tests were done on the river, where we anticipate the largest EV losses from simplifying. The Dynamic Sizing algorithm should perform even better on earlier streets!
If you’d like to learn more about how our Dynamic Sizing Algorithm works, check out this article:
{{width: 33%}}
{{/width}}

Monkey in the Middle: 3-Way Pot Heuristics
In this article, we will discuss the key strategic differences between this scenario and one where you face a continuation bet in a heads-up pot, how those differences factor into the GTO responses to these bets in 3-way pots, and when those differences are more or less salient.

The Trouble With Implied Odds
When we were brand new to poker strategy, many of us learned about concepts like equity, outs, and pot odds. When drawing, we were taught to count our outs, use those to estimate our equity, and then call or fold based on whether we were getting the right pot odds for the equity we had.

Poker Concepts You’re Using Wrong (and How They’re Hurting Your Winrate)
Language and poker are two of my great passions in life, so I’ve always been interested in poker’s unique and colorful vocabulary. As a poker coach, podcaster, and writer, I have particularly strong opinions about the language we use to explain poker strategy.