The Theory of Bounty Tournaments – Part 1: Prize Pool Fundamentals
Bounties are a significant new variable to take into account when studying tournament theory and ICM. This article explores the theoretical fundamentals of bounties, starting with an analysis of the structure and function of the two sub prize pools—the regular prize pool and the bounty prize pool—that comprise the total prize pool in bounty tournaments.
The two prize pools in bounty MTTs function both independently and in concert together. In this series of articles, we will analyze the structural differences between regular and bounty tournaments of all types, focusing in particular on how the addition of the bounty prize pool changes the impact and relevance of the Independent Chip Model (ICM), potentially leading to substantial adjustments in optimal ranges and strategies.
The Ratio of Bounty Prize Pool to Total Prize Pool
The main types of bounty tournaments that are widespread today are Standard Knockout tournaments (SKOs), Progressive Knockout tournaments (PKOs), and Mystery Bounties. (We created an introductory guide to these bounty formats that gives you an overview.) They are different from each other in the structure of the distribution of the bounty prize pool, but are the same in what event triggers the distribution: the prizes in the bounty pool are distributed whenever a player eliminates another player from the tournament.
In each of these formats, a portion of the buy-in goes to the bounty prize pool. How much is often listed prominently by separating the amounts of the buy-in that go to each sub prize pool. For example, $50+$50+$9 for a $109 buy-in event, where $50 goes to the regular prize pool, $50 goes to the bounty prize pool, and $9 goes to rake.
This basic but important information on how the buy-in is structured determines:
- How much the (starting) bounty is worth
- How much an optimal bounty strategy will deviate from strategies in regular, non-bounty tournaments as a consequence of (1).
The first step in analyzing a bounty MTT structure is to identify what percentage of the total prize pool is awarded through bounties.
Though 50% or 50-50 prize pool splits are one of the most common structures in all bounty types, in practice, operators spread events in all bounty formats—including PKOs—where more or less than 50% of the total prize pool is allocated to the bounty prize pool, including total KO events where 100% of the prize pool is awarded through bounties.
The trend is as follows. The greater the percentage of the buy-in that goes toward bounties:
- The more important it is to win bounties, as more of the prize pool is distributed via bounties and there is less value in laddering.
- The more optimal strategies will deviate from regular MTTs.
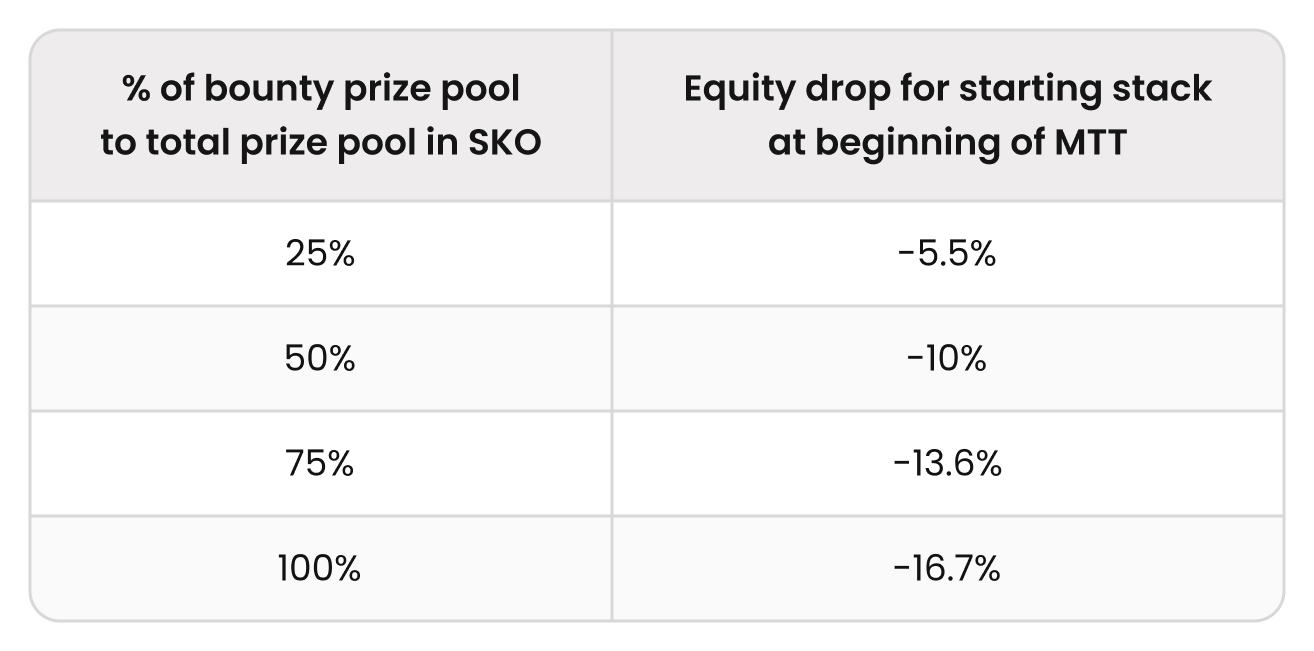
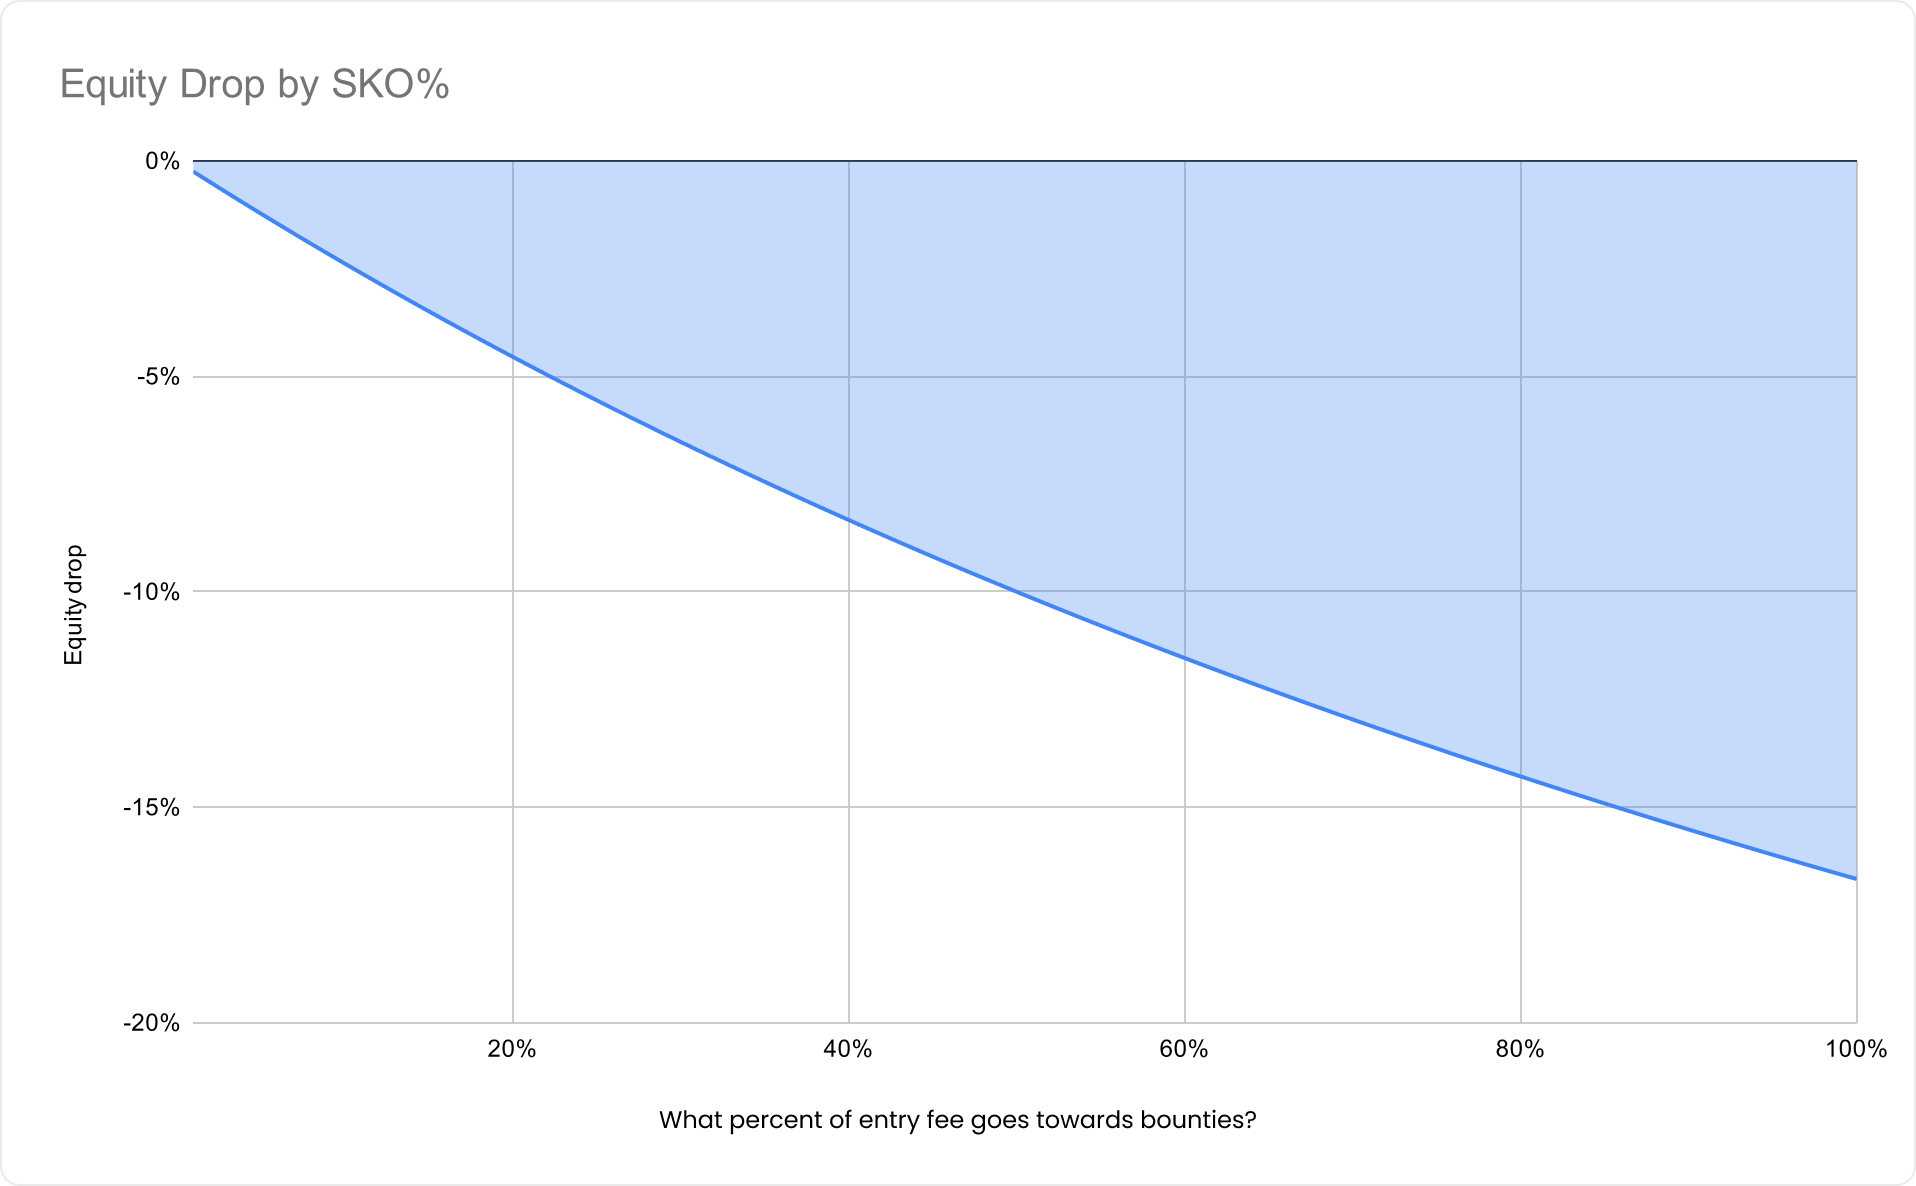
Adding bounties to the pot reduces the equity required to make a profitable call. This reduction is referred to as the “equity drop.” Essentially, it reflects how much lower your risk premiumRisk Premium
Risk Premium measures the extra risk you take stacking off in an MTT. It’s a measure of survival pressure and a valuable tool for understanding ICM spots. Risk premium is defined as the extra equity you’d need to call someone’s shove, compared to a (chip EV) pot odds calculation. RP = Required Equity (ICM) – Required Equity (cEV) when stacks are fully invested. Each player has a unique risk premium against every other player in a tournament. becomes compared to a similar situation without bounties.
In cases of a sufficiently large preflop shove (where the pot odds are close to 50%), the relationship between these variables is expressed by the following equation:
1) The Regular Prize Pool
In regular, non-bounty tournaments, there is one prize pool. A designated percentage of the field will make the money, usually somewhere between 10–20%, and the rest of the entrants lose their entry fee. Players who bust on or just after the money bubble earn the smallest part of the prize pool. Prizes rise slowly at first, increasing more steeply as the tournament progresses, with the winner of the tournament taking home the largest prize.
This means that, unlike in a cash game, chips do not maintain a one-to-one cash value as the tournament progresses. This changing chip-to-money relationship can easily be gleaned from looking at the monetary prize that the winner of the tournament takes home: they typically win less than 20–30% of the prize pool after collecting 100% of the tournament chips. To understand the implications of this dynamic, players often use models like ICM to develop optimal strategies to adjust their play in tournaments, particularly for the later stages of the tournament.
In bounty tournaments, the prize pool is split into two parts. A designated part of the buy-in goes to the regular prize pool, which usually has a similar structure to regular tournaments. The remainder of the buy-in goes to the bounty prize pool, which distributes prizes differently from the regular prize pool.
2) The Bounty Prize Pool
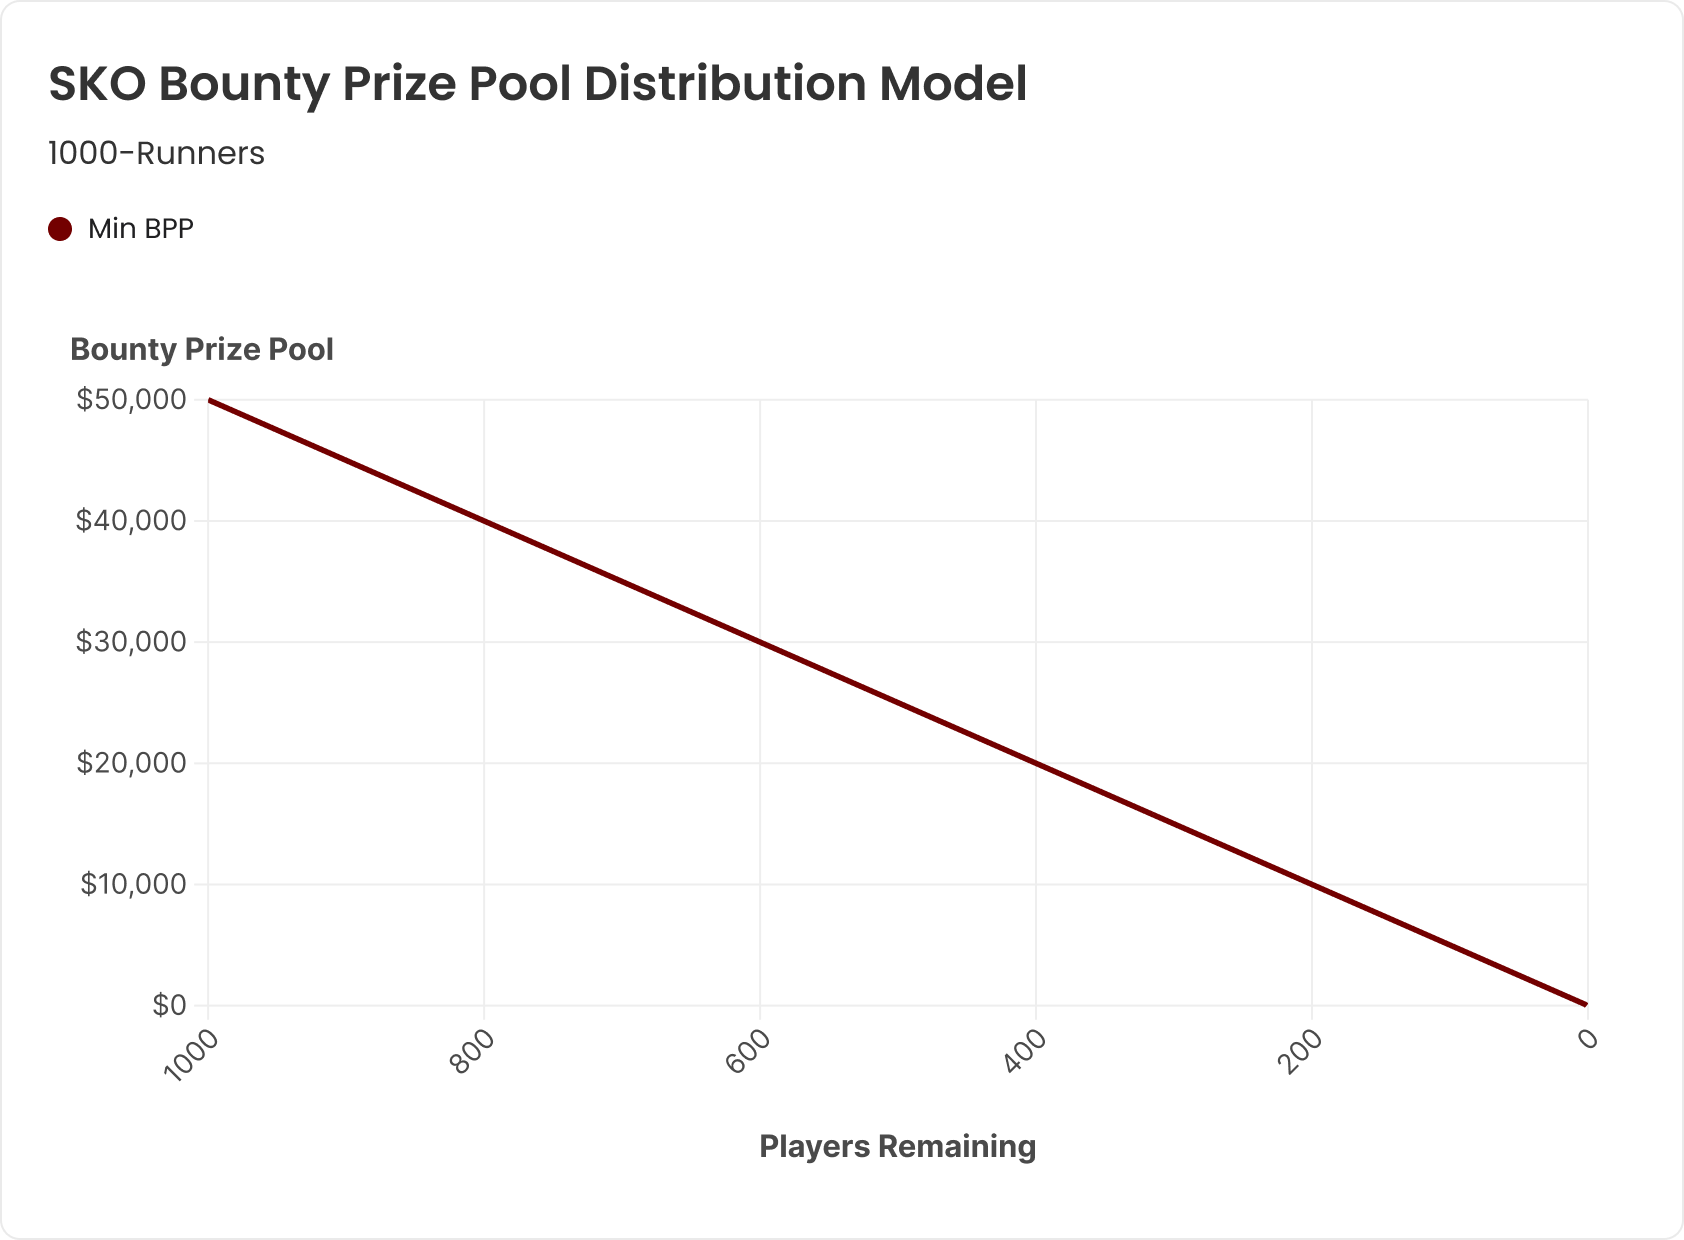
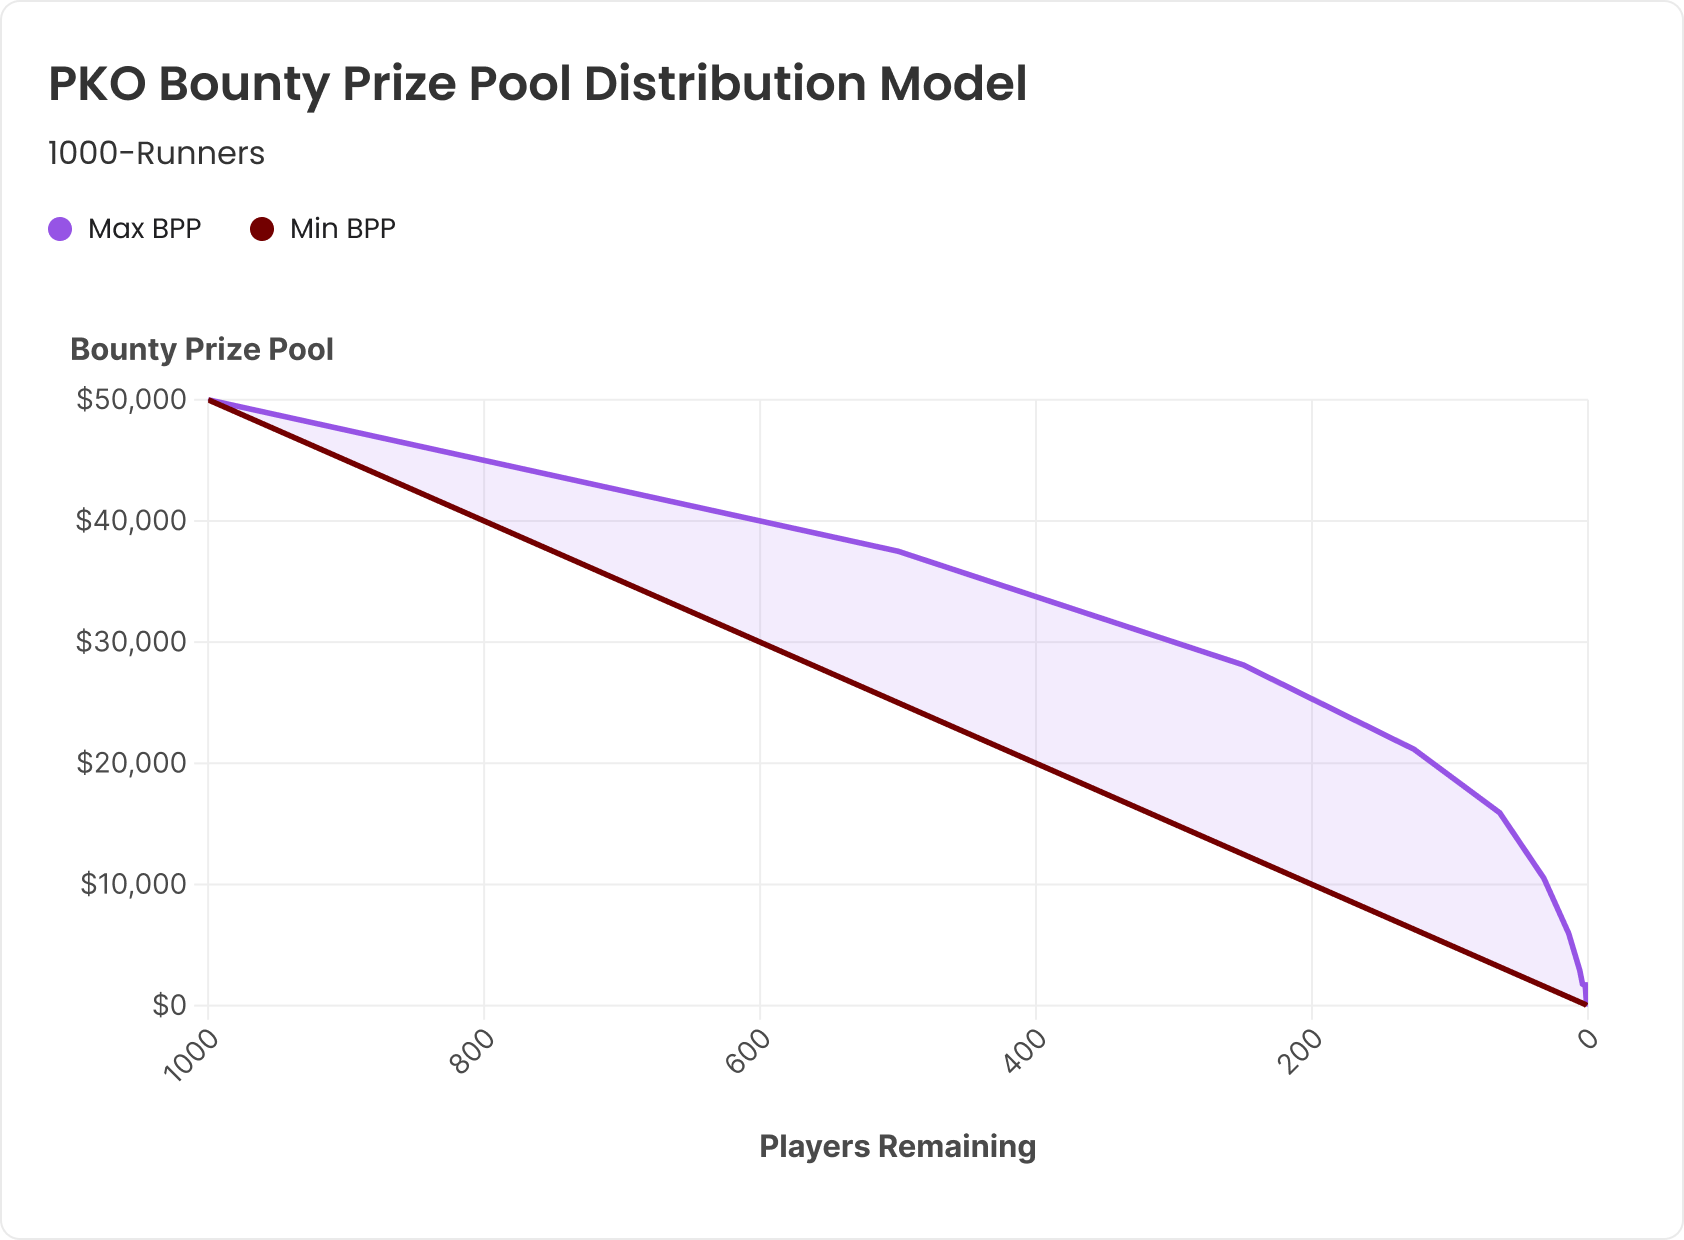
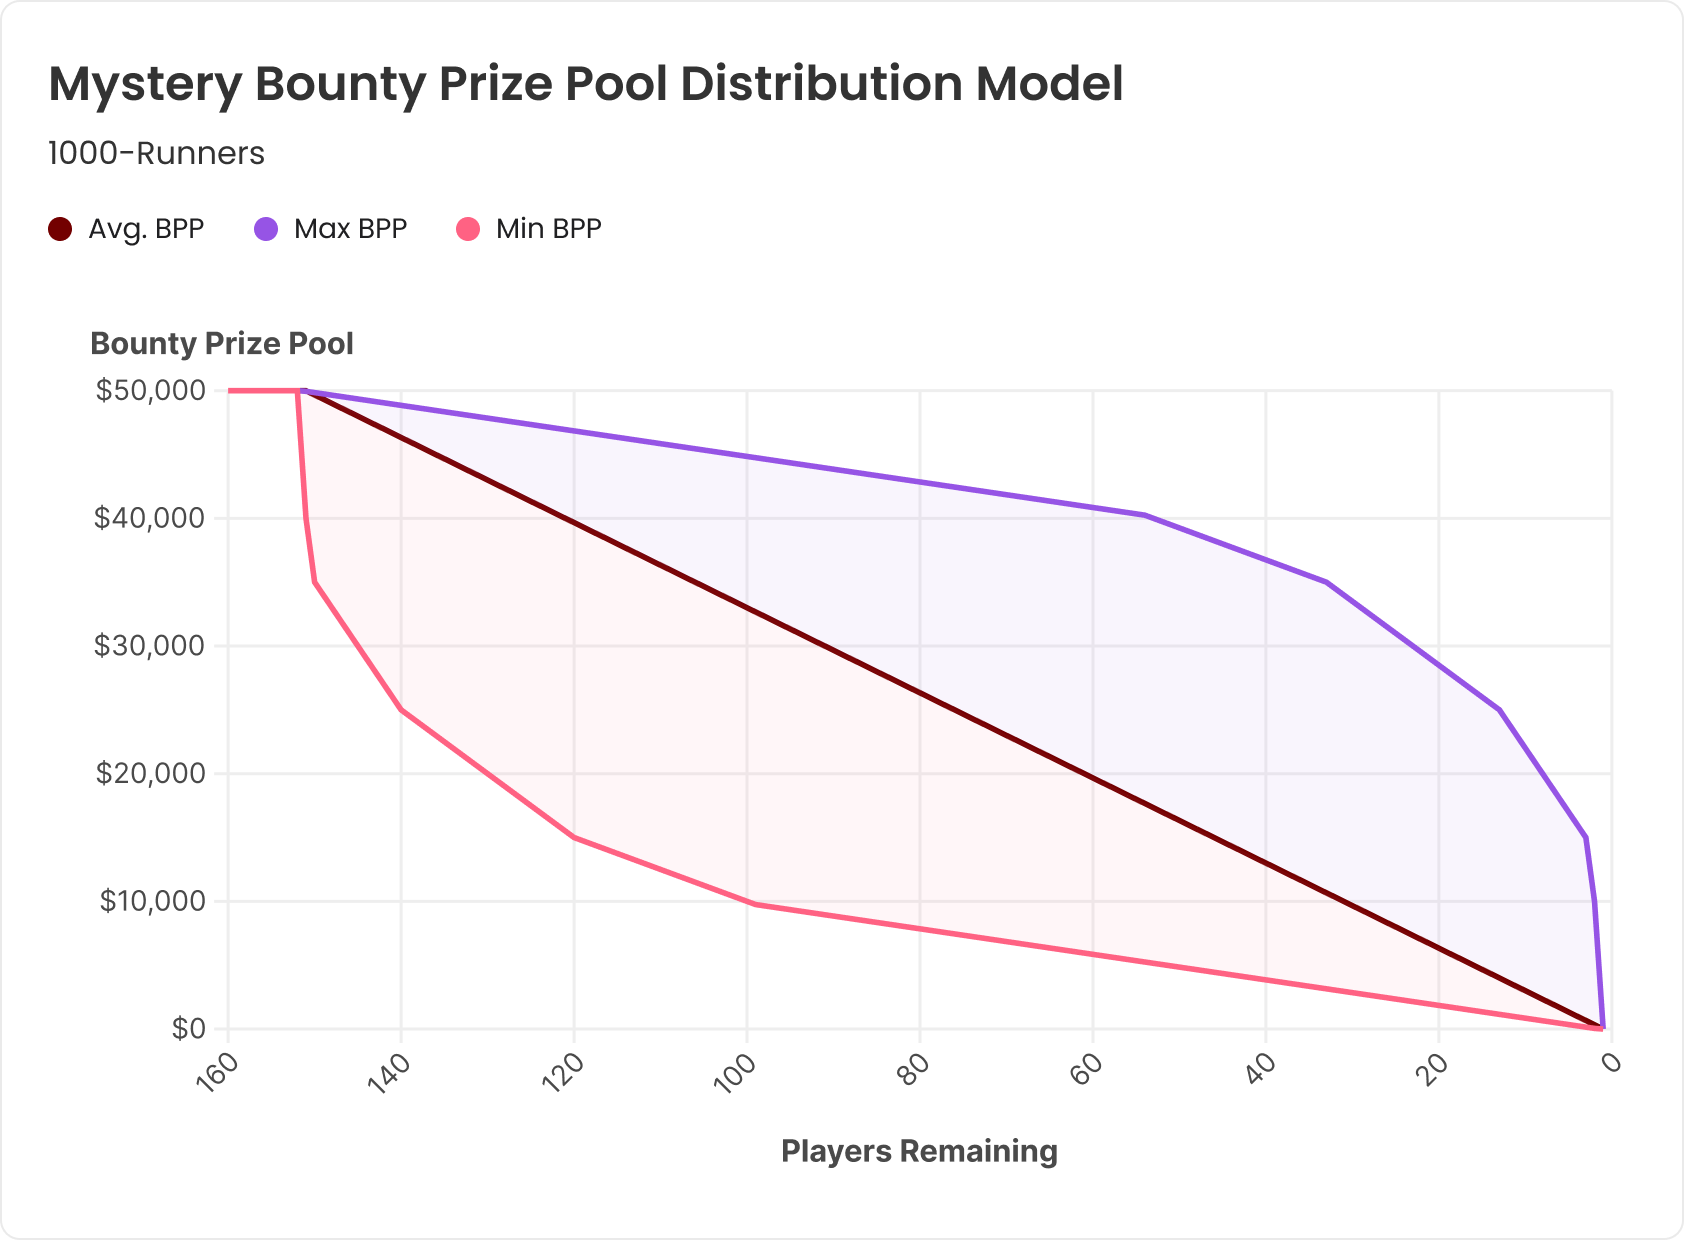
In SKOs and PKOs, bounties usually come into play in the first hand of the tournament. In mystery bounties—and some SKOs—bounties are only awarded later in the tournament (i.e., the bounty period). The possible distributions of the bounty prize pool are modeled in the following graphs. In all three graphs, the model assumes 1000 runners in a $100 buy-in event, with $50 of the buy-in going to the bounty prize pool. In the mystery bounty model, 15% of the field makes the bounty period and is eligible to win a share of the bounty prize pool.
2a) SKOs
As we can see from the graphs modeled above, SKOs have the simplest distribution of bounties. In the SKO model, a fixed $50 bounty is awarded to every player who eliminates another player. Thus, the bounty prize pool decreases linearly throughout the tournament, from the first elimination to the last. In all bounty formats, the winner of the event also always wins their own bounty.
2b) PKOs
In the graphs of the PKO and Mystery Bounty distribution models, the shaded areas indicate the range of possible distributions of the bounty prize pool, as the amount of the bounties won is not fixed throughout the bounty period. The range of distributions is demarcated by modeling the most extreme (and highly unlikely) possibilities for the order in which bounties are paid out. The shaded areas show the range of the possible $values of the remaining bounty prize pool by the number of players remaining in the tournament, as the actual distribution of the bounties will usually be unique in every tournament. At any given point in the tournament, the remaining size of the bounty prize will fall somewhere within the shaded area.
These dynamics of when, how much, and in what order bounties are distributed in PKOs lead to significant variation in how much of the bounty prize pool remains in the later stages of the tournament.
Note that in the above PKO prize pool graph, the lower bound of the ‘range’ is the same linear distribution as in the SKO model. However, the only way a PKO prize pool could be awarded in that manner is if:
- Every player in the tournament only eliminates one other player
- With the last player to win the bounty always being eliminated in sequential order.
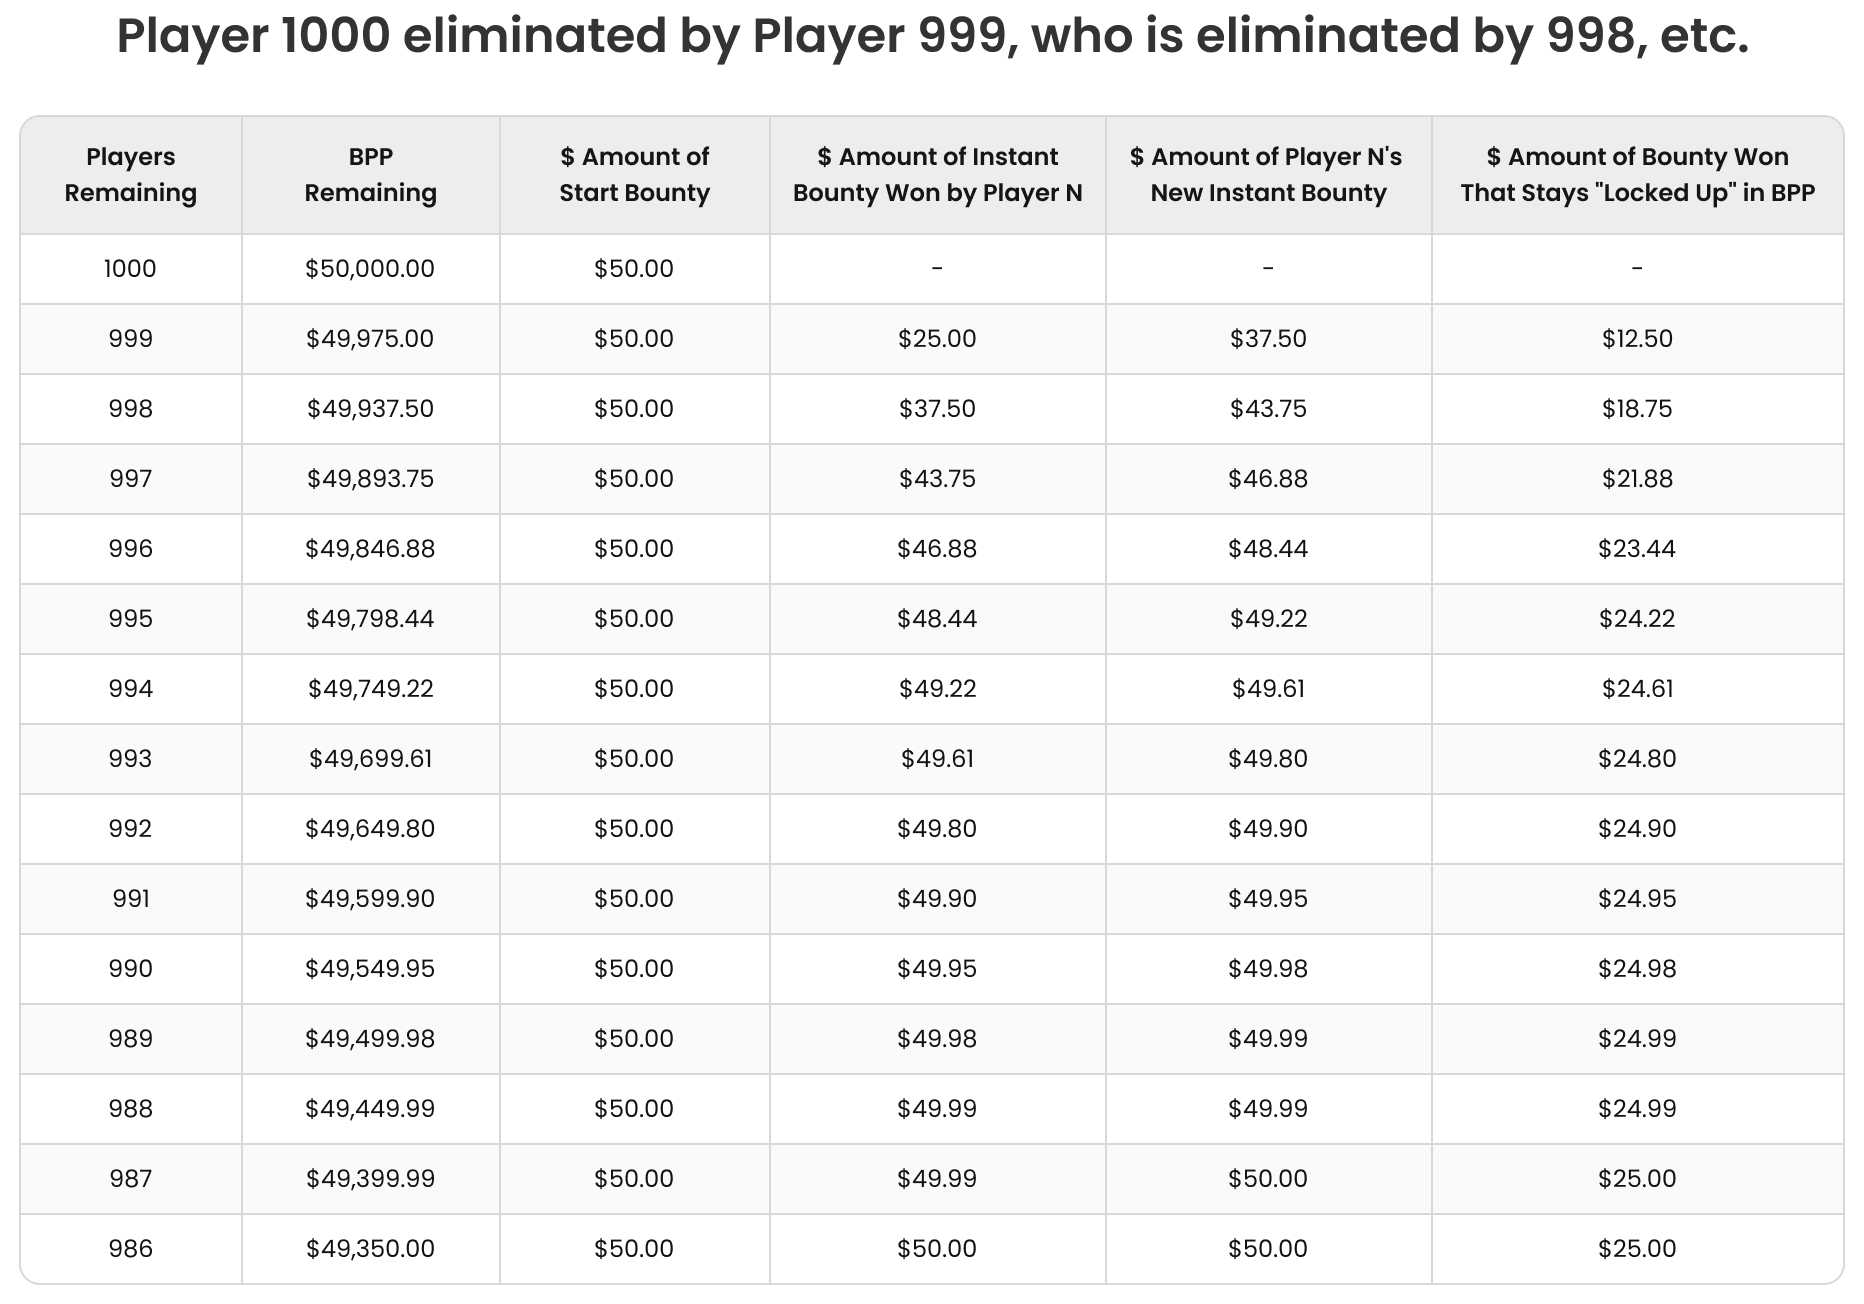
For example, in a 1000-runner field, 999th place eliminates 1000th place. Then 998th place eliminates 999th place, winning their 1.5 starting bounties. Then 997th place eliminates 998th place, and so on:
Looking at column 4—”$ Amount of Instant Bounty Won by Player N”—the actual $value of (the instant bounty) won tops out at $50This is because the total remaining value of the earlier bounties won by Players 987-999 is capped at $25. by the time Player 986 is eliminated. As each player’s starting bounty is won over and over, 50% of the total bountyThe other 50% of the eliminated player’s total bounty is added to the winning player’s total bounty, with 25% of each bounty won added to the winning player’s instant bounty, while the other 25% remains in the bounty prize pool but gets earmarked as part of the instant bounty of the next player to win that bounty, Player 985 (see columns 5 and 6). is won immediately (the instant bounty) and removed from the prize pool. The remaining value of each starting bounty drops toward zero as it is won over and over, and halved again and again, by new players.
Conversely, the upper bound of the ‘range’ models the slowest possible rate at which the bounty prize pool can be distributed in practice. It represents a scenario in which each player still in the tournament, when 50% of the field remains, has exactly eliminated only one other player. Then 50% of that remaining field (25% of the total entrants) eliminates only exactly one other player, etc. In this scenario, each entrant’s original starting bounty is won the minimum amount of possible times (in contrast to the prior scenario, where each starting bounty is won the maximum number of times). Thus, the prize pool in this scenario remains as large as mathematically possible as players get eliminated.
The possibility of either of these extreme scenarios happening becomes increasingly unlikely the more entrants there are in a tournament. However, in practice, the bounty prize pool distribution in PKOs is much more likely to trend towards the higher end or middle of the range, rather than the lower end.
The following correlations with field size can be made:
- Large-field MTT bounty prize pool distributions usually are closer to the top of the possible range.
- Conversely, smaller-field bounty tournament prize pool distributions tend to fall more in the middle to mid-bottom of the range of possible distributions.
It is more likely that one or a few players will eliminate a greater percentage of the total runners of the tournament in a smaller-field MTT than it is in a large-field MTT, thus draining and locking up more of the bounty prize pool more quickly.
2c) Mystery Bounties (and Super Bounties)
In Mystery Bounties, contrary to SKOs and PKOs, the value of each bounty won is a random amount and not known in advance. Therefore, we can only know the value of the average bounty:
Average bounty = the remaining bounty prize pool / the number of players remaining
Note that the line that splits the range of distributions for mystery bounty prize pools is linear and exactly the same as in the SKO model. This is due to the fact that both models represent the distribution of the average bounty, the difference being that the average mystery bounty in tournaments with the same buy-in structure will be larger than the average bounty in the SKOThe actual fixed $value of the SKO bounty, as the bounty period starts later in the (mystery bounty) tournament rather than at the beginning.
Super Bounty Model
The prize pool distribution in the “super bounty” or “quattro bounty” format, which is sometimes spread by operators like Triton, is similar to the mystery bounty model but with all of the shaded area removed, leaving just the central line. These events play similarly to mystery bounties as the bounty period also begins late in the tournament rather than at the beginning. However, unlike mystery bounties, the super bounty is not a mystery; it is a fixed, known amount similar to SKOs. For example, in the “quattro bounty” format, the bounty period begins when 25% of the field remains. So, each bounty won in the bounty period is 4x the amount of the entry fee that each player contributed to the bounty prize pool.
Mystery Bounty Model
In mystery bounties, however, the bounty prize pool remaining at any given point in the bounty period—especially in large fields—is often slightly above or slightly below what it would be if every bounty won was the average bounty value. However, it is possible for the bounty prize pool remaining to be anywhere in the shaded areas. Let’s consider what both bounds of these shaded areas represent in the mystery bounty model:
- The upper bound of the range is the extreme scenario where all of the smallest bounties are won first, then the next smallest, etc.
- The bottom of the range is the opposite extreme, where the largest bounties are all won in order from largest to smallest.
These extremes are, of course, unlikely to happen except in the smallest of fields.
The Bounty Prize Pool Is Chip EV, Not ICM
The major difference between the bounty prize pool and the regular prize pool in all bounty tournaments is that the bounty prize pool is awarded randomly; so not by a player’s placement in the tournament (1st, 2nd, etc.).
Mystery bounties, in particular, provide the most obvious examples of the impact of this mechanic. For example, in the first $1k mystery bounty event held at the WSOP in 2022, the winner of the top bounty won a $1m prize from the bounty prize pool, while the actual winner of the tournament only won about $750,000 from the regular prize pool. In other words, a significant amount of the prize pool that would normally have been awarded to the top finishers of the tournament was instead distributed at random intervals during the bounty period, and some players who finished well before the final table won as much or more than others who actually made the final table or won the tournament.
Why does this distinction between the distribution of the two prize pools matter so much?
Because the bounty prize pool is not awarded according to placement, ICM is not a similarly applicable model for developing strategies in relation to the bounty prize pool as it is with the regular prize pool in bounty MTTs (and with the entire prize pool in non-bounty MTTs).
In other words, the portion of the total prize pool allocated to the bounty prize pool is Chip EV.
ICM models use stack size distributions, the actual payout structure of the regular prize pool by place finished, and field size to calculate bubble factors and their correlating risk premiums.
In a bounty tournament, a player’s “share” of the prize pool is not as substantially contingent on their stack size.
While a player’s share of the regular prize pool and future bounty EV share of the bounty prize pool does correlate with stack size, the bounty itself can be won by any player who covers another, even if only by the slimmest of margins with the shortest of stacks—for example, one player has .2bb but another has .1bb. The $value of the bounty won by the player with .2bb would be the same as if a player with 100bb eliminates the .1bb player. In such a situation, the absolute value of the bounty will dwarf the ICM value & the future bounty EV share of the .2bb stack, particularly before there are large pay jumps.
In addition, placement is not (or is not as much) of a factor in bounty tournaments, as it is possible for the second player to leave the tournament with a piece of the prize pool (i.e., a bounty), assuming they were the one to eliminate the first player to bust. These factors all lead to Chip EV being a more appropriate model for the bounty prize pool than ICM.
Conclusion
The introduction of a bounty prize pool potentially leads to numerous adjustments in optimal ranges and strategies from non-bounty MTTs.
Key Takeaways:
- ICM impacts the regular prize pool similarly to non-bounty tournaments.
- The bounty prize pool is not impacted by ICM and is Chip EV.
- An “equity drop” refers to the reduction in the amount of equity a covering player needs to profitably call when a bounty is in play (and can be won).
Part 2 takes a deep dive into the implications of the above key takeaways, particularly in terms of how the equity drop or negative risk premium pressure from the bounty prize pool impacts ICM.
Wizards, you don’t want to miss out on ‘Daily Dose of GTO,’ it’s the most valuable freeroll of the year!
We Are Hiring
We are looking for remarkable individuals to join us in our quest to build the next-generation poker training ecosystem. If you are passionate, dedicated, and driven to excel, we want to hear from you. Join us in redefining how poker is being studied.

