Money Bubble vs Final Table Bubble
Is one bubble the same as another? Should we play more conservatively on the money bubble of a small-field tournament, a large-field one, or the final table bubble? Are there nuances based on the makeup of the event itself?
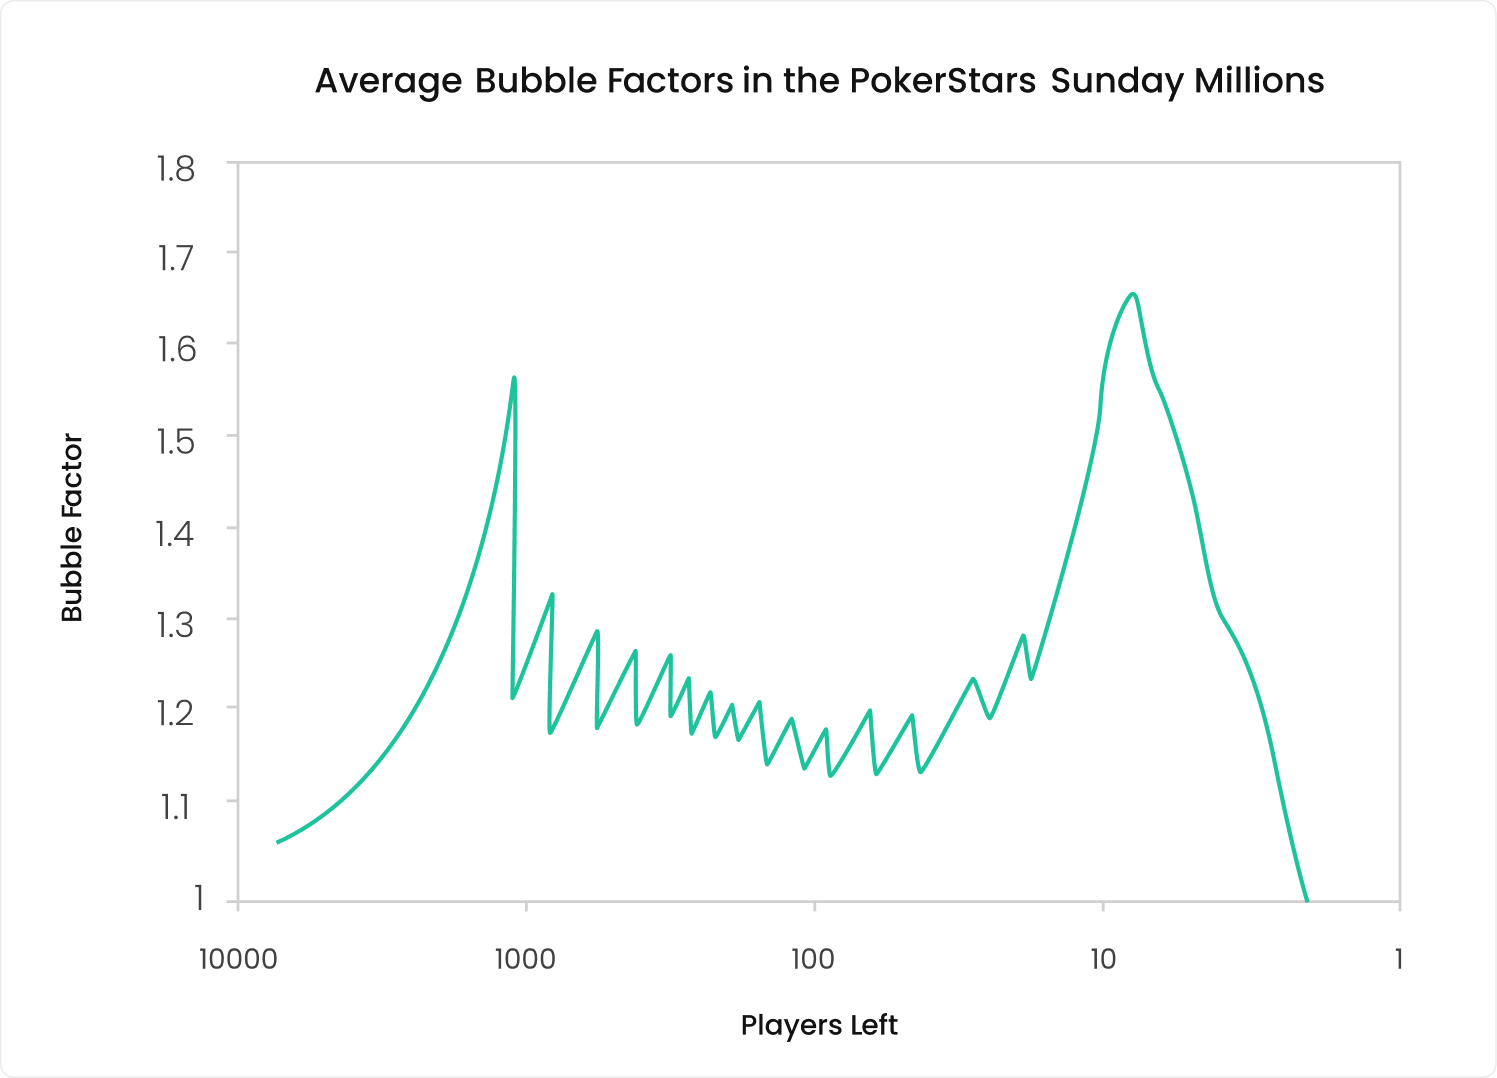
In several of the articles that I have written so far on the topic of ICM, the below image makes an appearance because it is so illustrative. It is a graph of the average bubble factor of the average player at different stages of Pokerstars’ flagship Sunday tournament: the Sunday Million. It’s from the (nearly twenty years old) book ‘Kill Everyone‘ (2007).
What (literally) stands out most from the graph is that the average bubble factor peaks a first time on the money bubble. A second peak coincides with the final table bubble, dropping sharply with each elimination. The final table bubble being more extreme than the money bubble surprises some people, but it makes sense because making the final table puts you in a position to win the biggest prizes of the tournament.
When people learn about this, they may come to the conclusion that the strategies for money (ITMIn the money
Any finish in a poker tournament where the player has won money for their placement. Also known as “having cashed”. Often abbreviated to ITM.) bubbles and final table (FTFinal Table
The last table remaining in a poker tournament. Often, people use the abbreviation FT to refer to it.) bubbles are the same, but this is not quite the case. Significant differences exist between the bubbles that form at these two key events of a multi-table tournament.
Same Chip Distribution, Different Bubbles
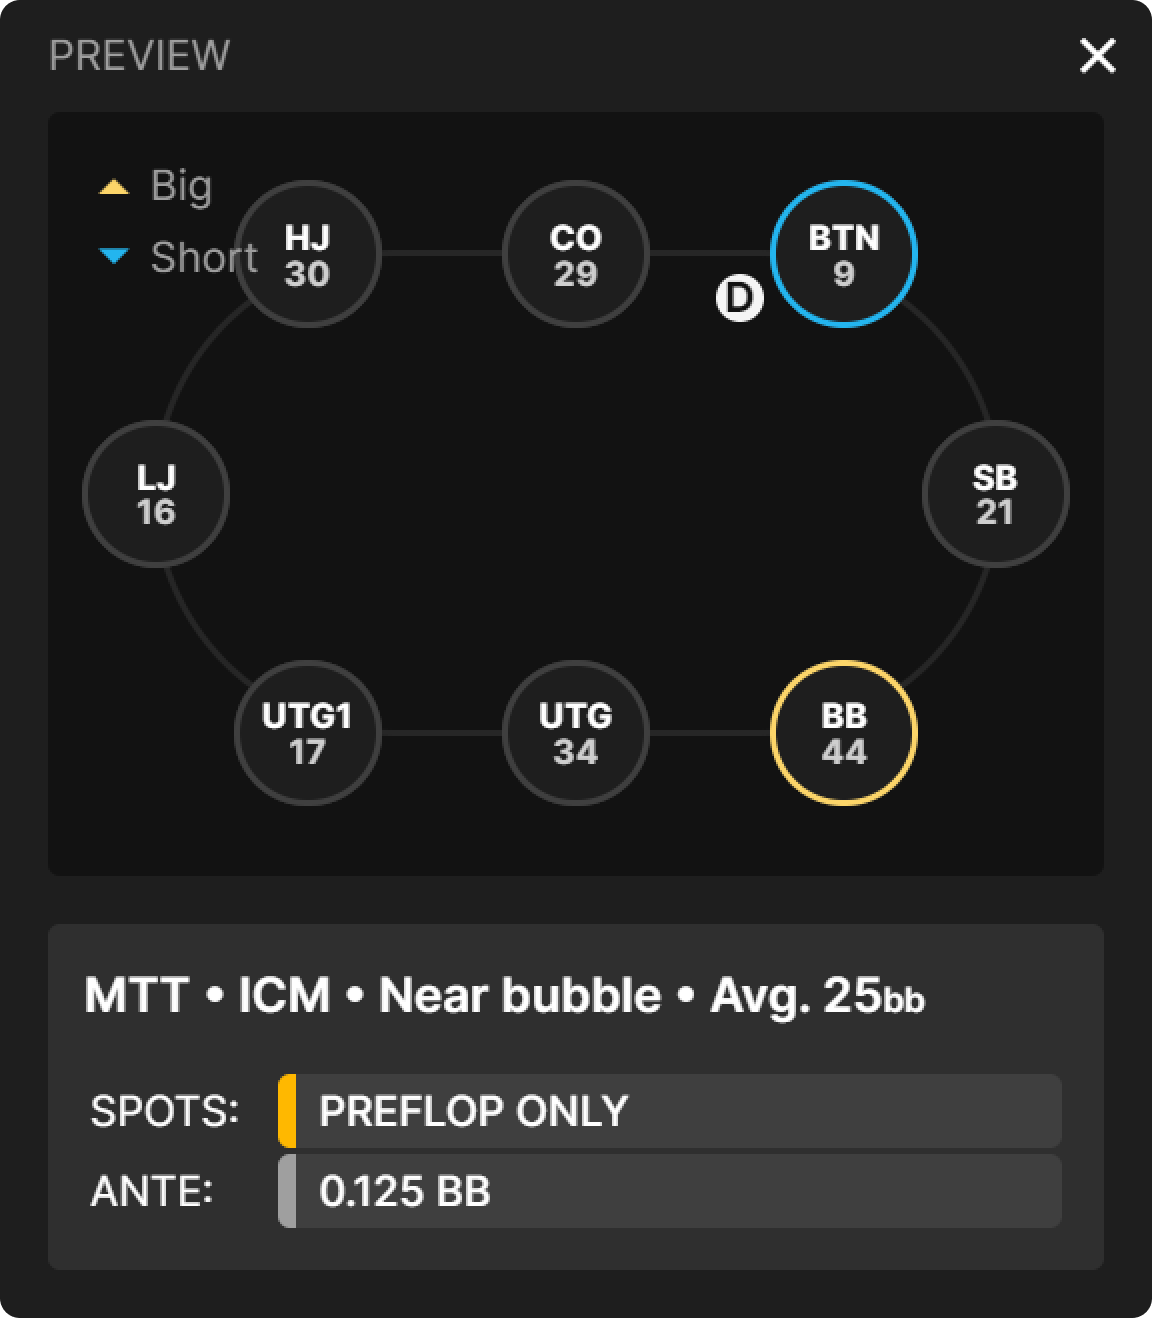
Let’s explore some carefully selected spots to get to the heart of the difference between these bubbles. Both spots feature the same chip distribution. The stack sizes at the table are as follows:
As you can see, we have a mix of stacks. Focusing on the ones in the three latest positions, we find that the BTN is the short stack with 9bb, the SB is the medium stack with 21bb, and the BB is the big stack with 44bb.
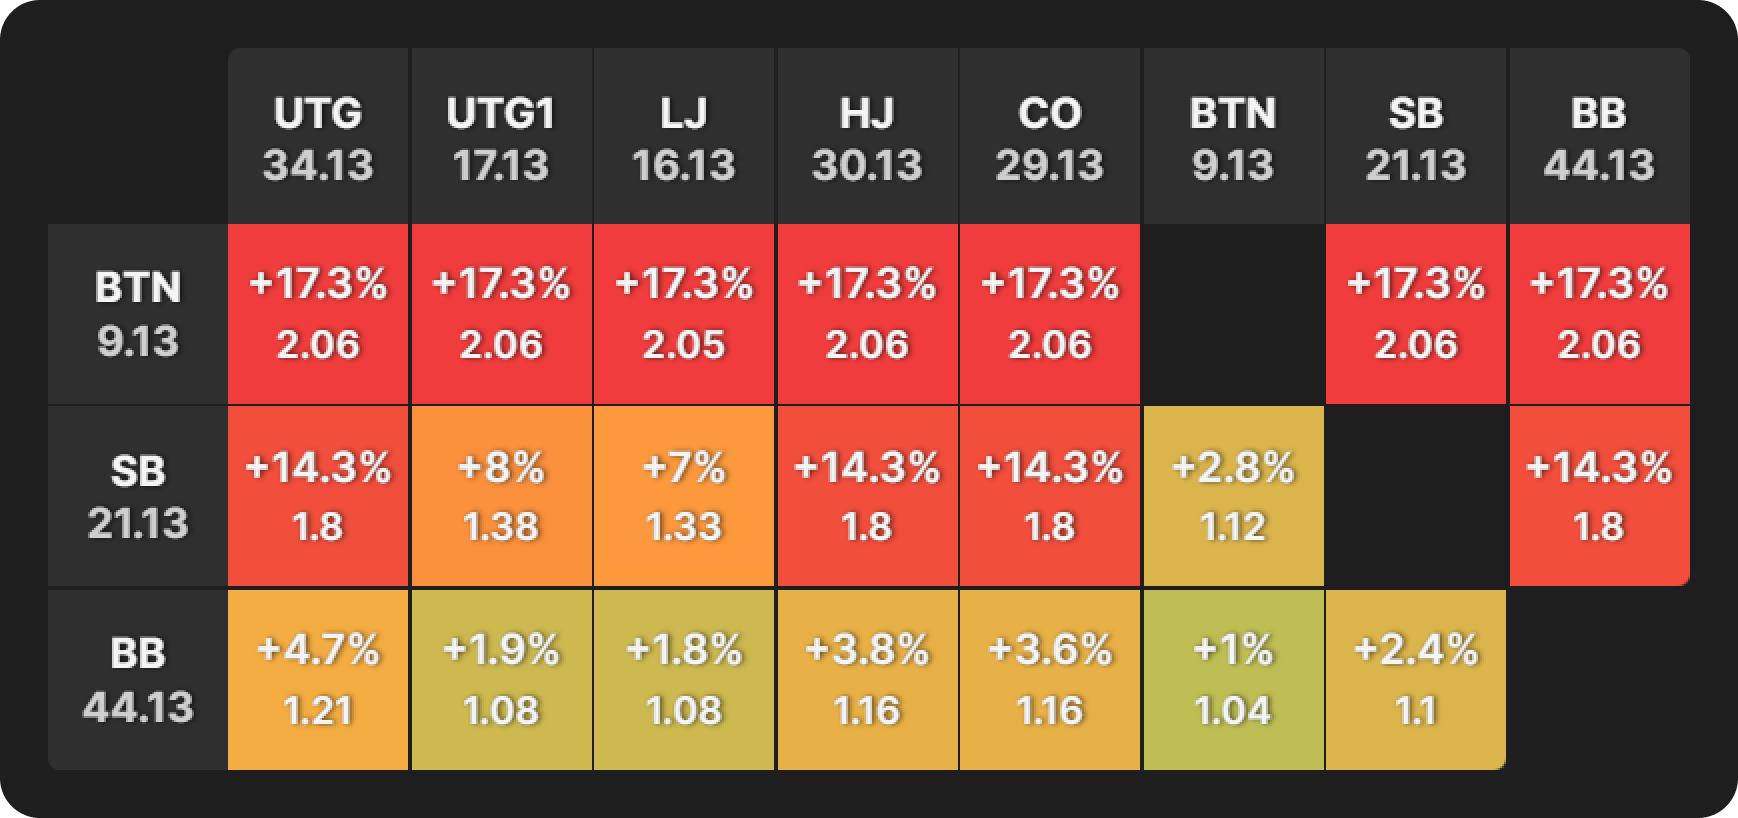
These are the bubble factors for this spot when the stage of the tournament = the money bubble.
I have cropped the bubble factor table to isolate the last three players, who conveniently have the smallest, middling, and largest stacks.
Let’s interpret this table one row at a time.
- Smallest stack: The BTN is under extremely heavy ICM pressure. The bubble factor is constant regardless of the opponent; it is 2.06, which means we need 17.3% extra equity to justify getting involved in the pot and potentially stacking off.
- Middling stack: The SB experiences moderate to heavy ICM pressure on them, mostly depending on whether they are covered or not. When covered, their bubble factor is 1.8, but it can be as low as 1.12 against the BTN.
- Largest stack: The BB has barely any ICM pressure on them. Against the BTN, it is 1.04, which is basically Chip EV. It’s still quite low, even against UTG, the second chip leader, at 1.21.
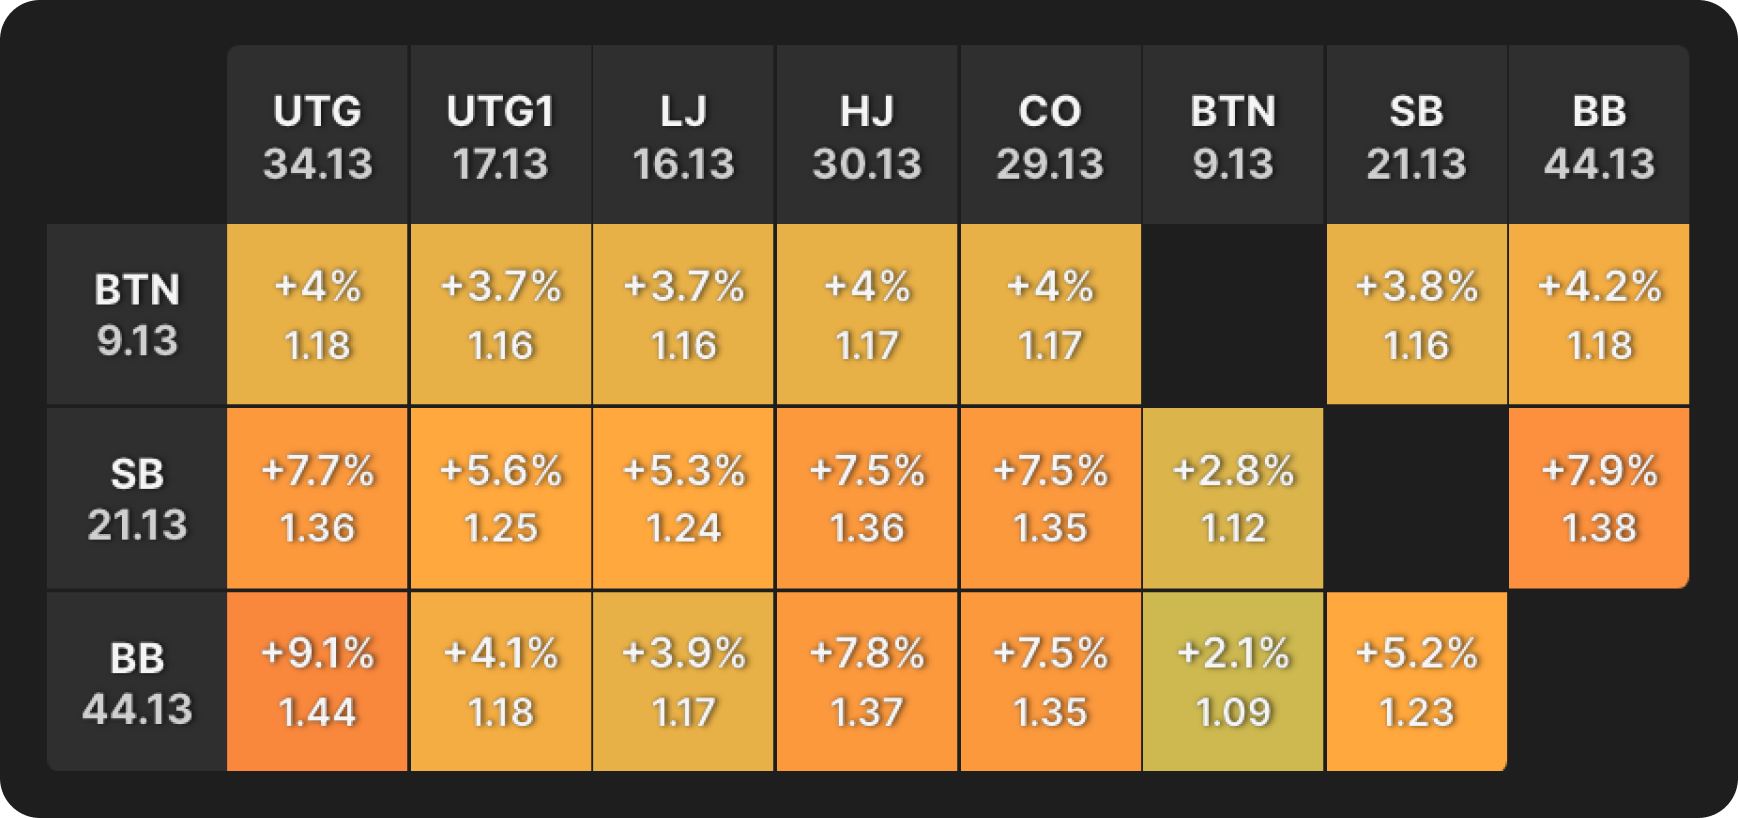
Now, let’s admire the bubble factors of the same spot in terms of chip distribution but different in terms of the stage of the tournament = final table bubble.
Round 2 of bubble factor table analysis.
- Smallest stack: The BTN has gone from extreme ICM pressure to very little. With a bubble factor peak at 1.18, which is almost as low as the chip leader had in the last example.
- Middling and largest stacks: The ICM pressure is now on our medium and big stacks. It’s not as suffocating as it was for the short stack on the money bubble, but it is much greater than it is for the short stack now, at the final table bubble.
- Largest stacks: In fact, the highest bubble factor we see is when the BB goes up against UTG, in what is a chip leader vs second chip leader battle. In that confrontation, the chip leader (BB) has a bubble factor of 1.44, indicating they need an additional 9.1% equity to call an all-in from the second chip leader (UTG).
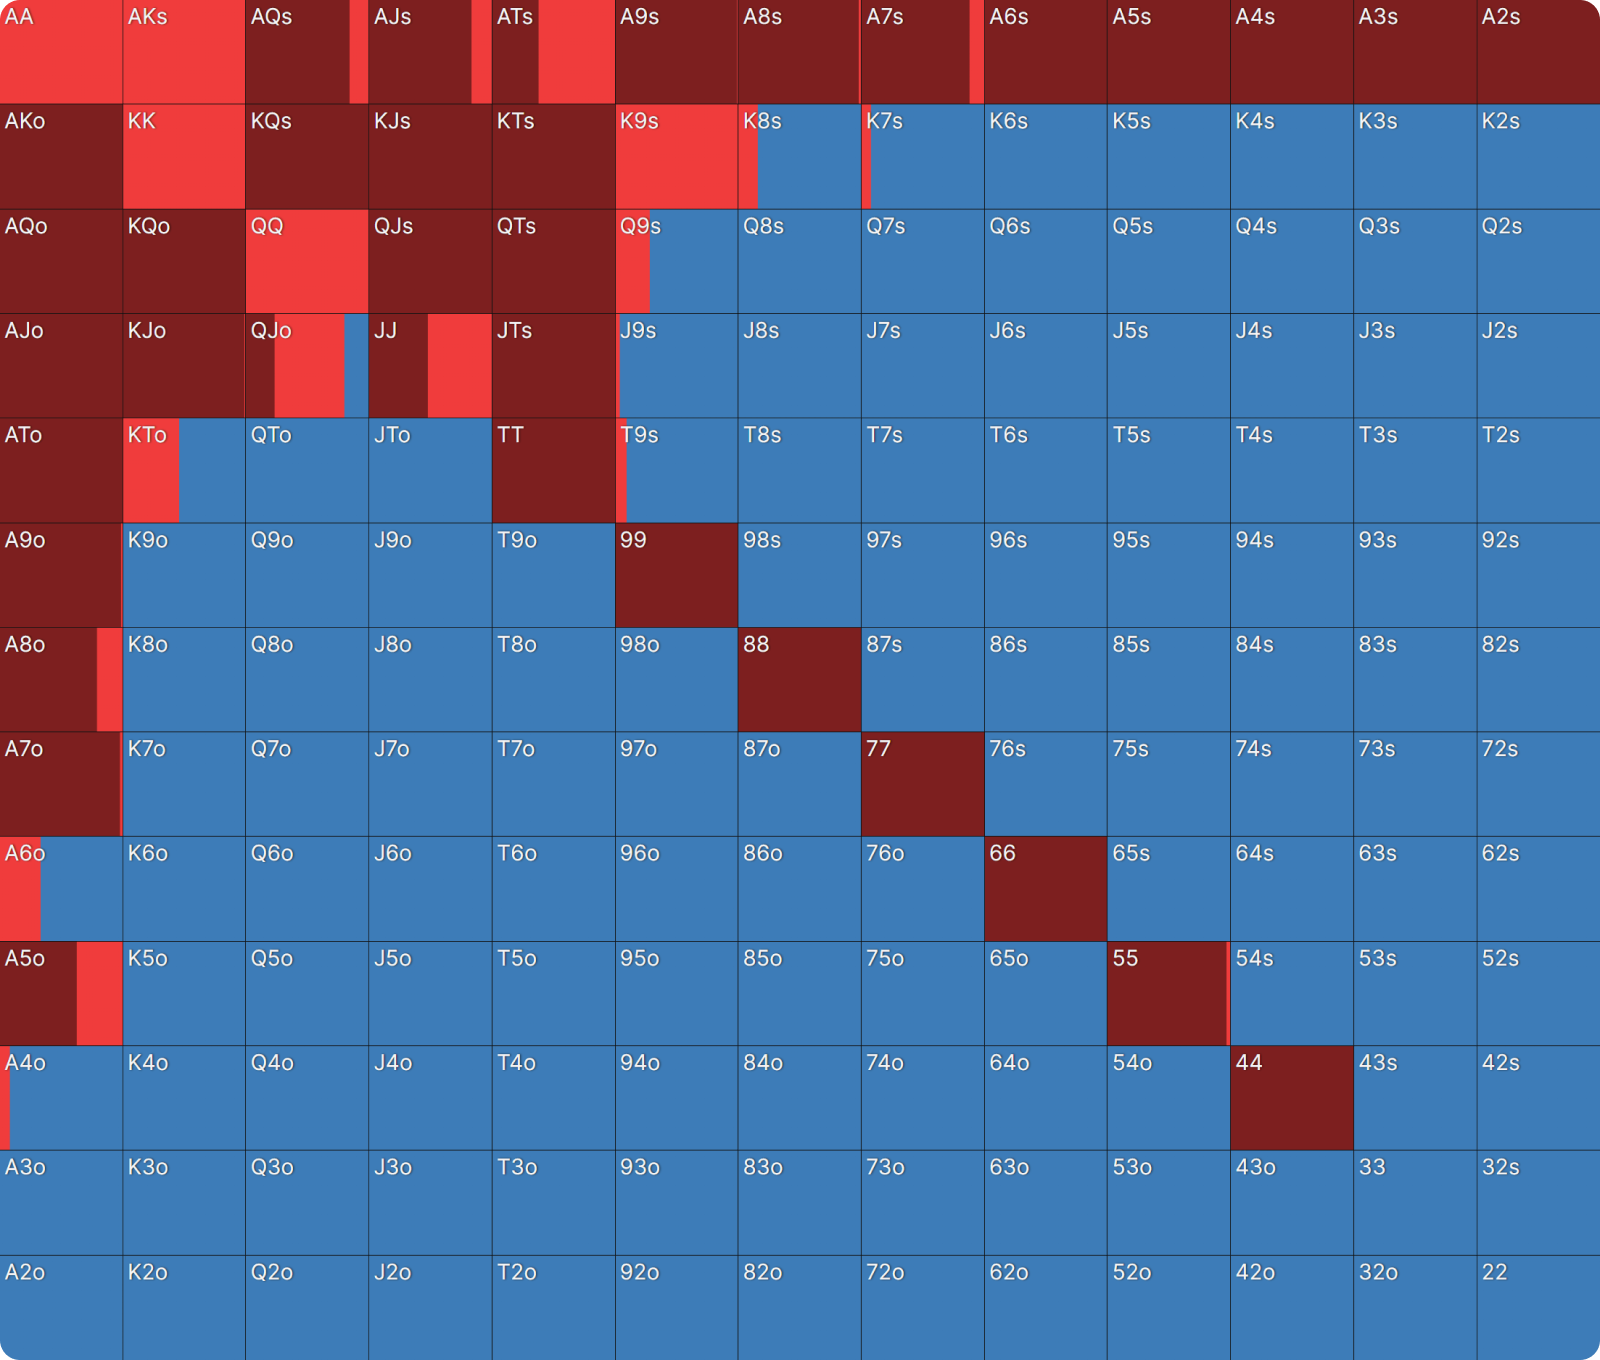
We can see this reflected in the strategies. Here we have BTN’s opening strategy on the ITM bubble:
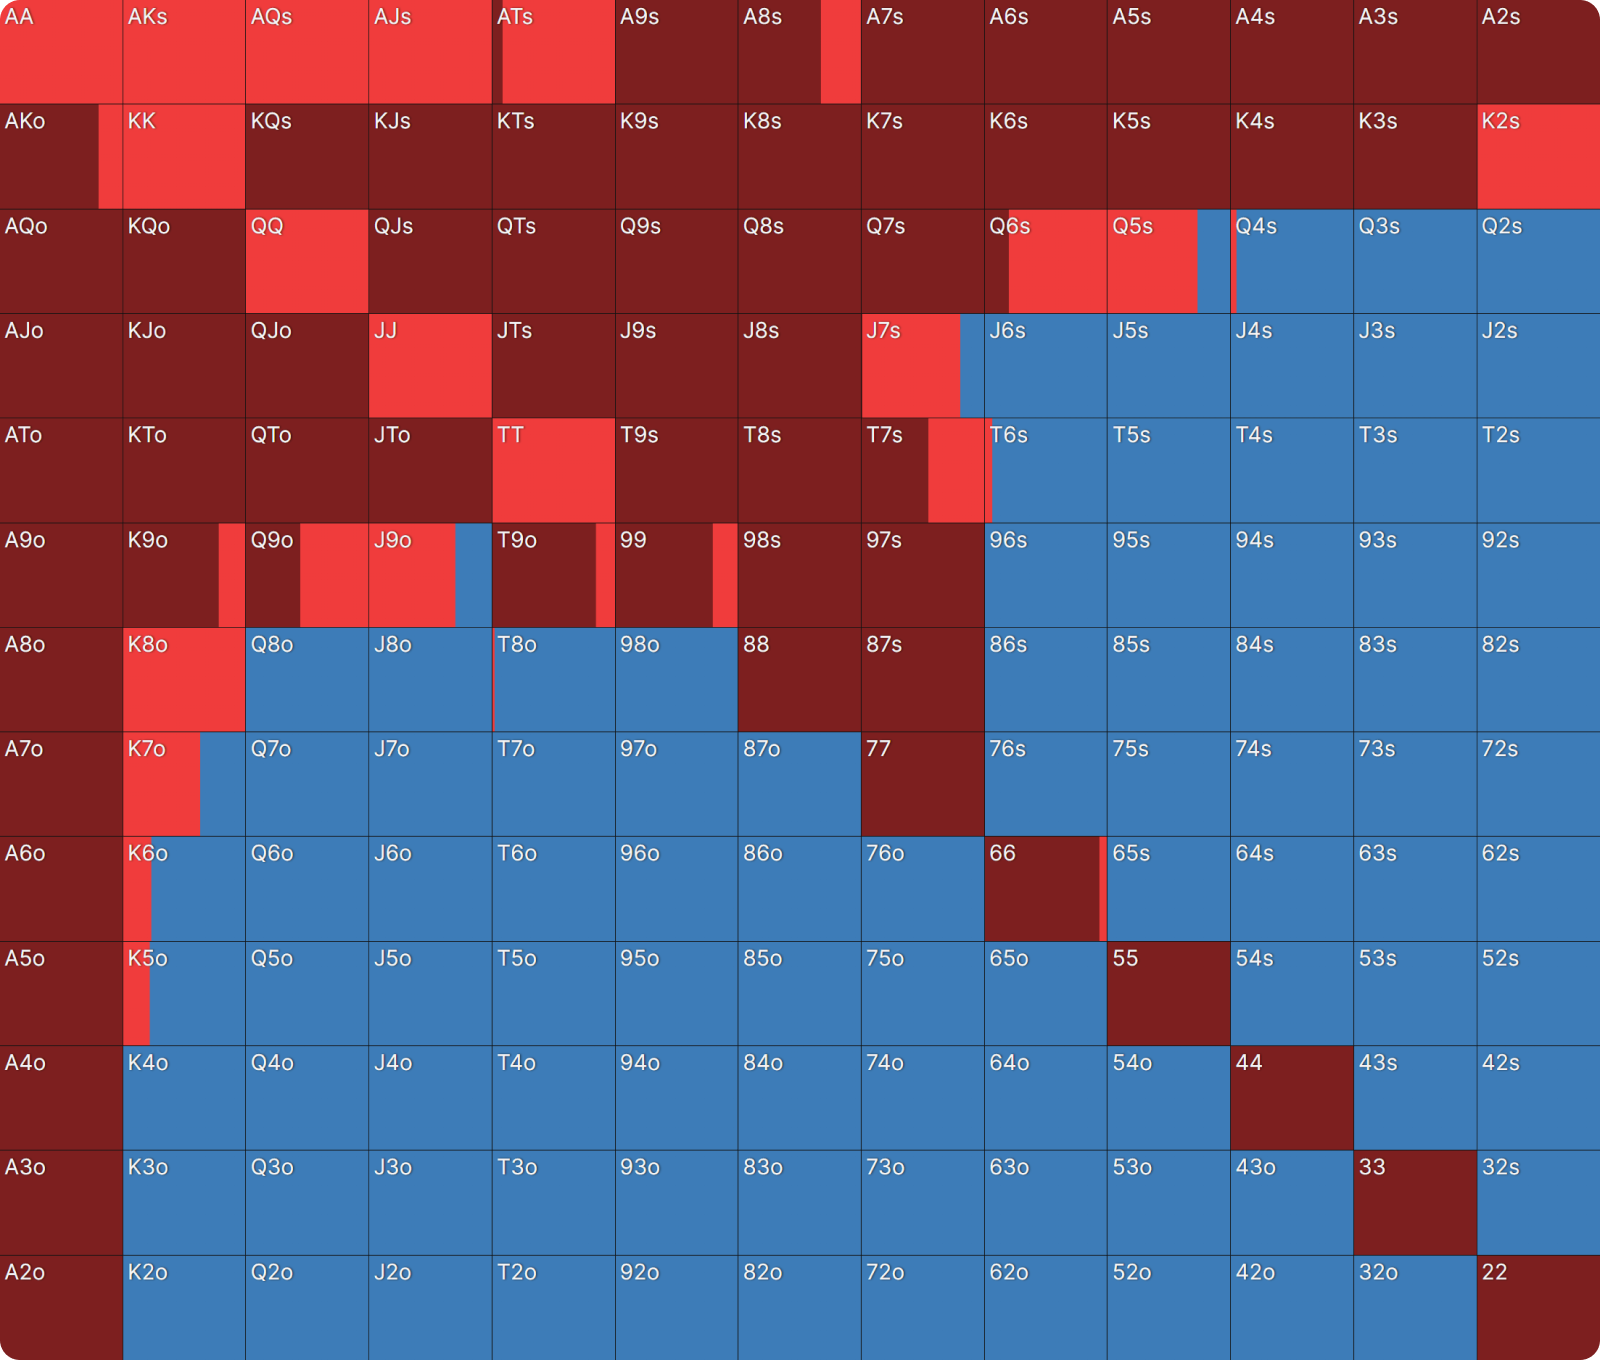
And this is the same spot on the FT bubble:
The BTN’s range has essentially doubled. In both spots, they are most at risk of elimination, but they are more incentivized to survive on a money bubble compared to on a final table bubble, where they are encouraged to be more ambitious. They become relatively bolder in their strategy, looking for a double-up to get them back in the game and fight for higher-up prizes, maybe even ‘play for the win’ again.
Short Stacks Should Prioritize Min-Cashing
Tournament Simulation
To show you what is happening here, I simulated a tournament using this free “MTT ICM Calculator” tool from our colleagues at HoldemResources Calculator. The payout structure is based on the ICM sims with 1,000 runners that can be found in the GTO Wizard solution library. To keep it simple, I made it a $100 rake-free buy-in, amounting to a $100,000 prize pool, which reserves 15.19% of it ($15,190) for the winner.
Money Bubble Simulation
The last 15% of runners in the tournament (150) get paid, and I simulated a bubble with a wide mix of stacks. You can see the outputs here.
- In this example, our shortest-stacked player had one starting stack,
- Their tournament equity was $281.16. The min-cash in this tournament was $200.
- When doubling up (to two starting stacks), their new tournament equity becomes $374.32.
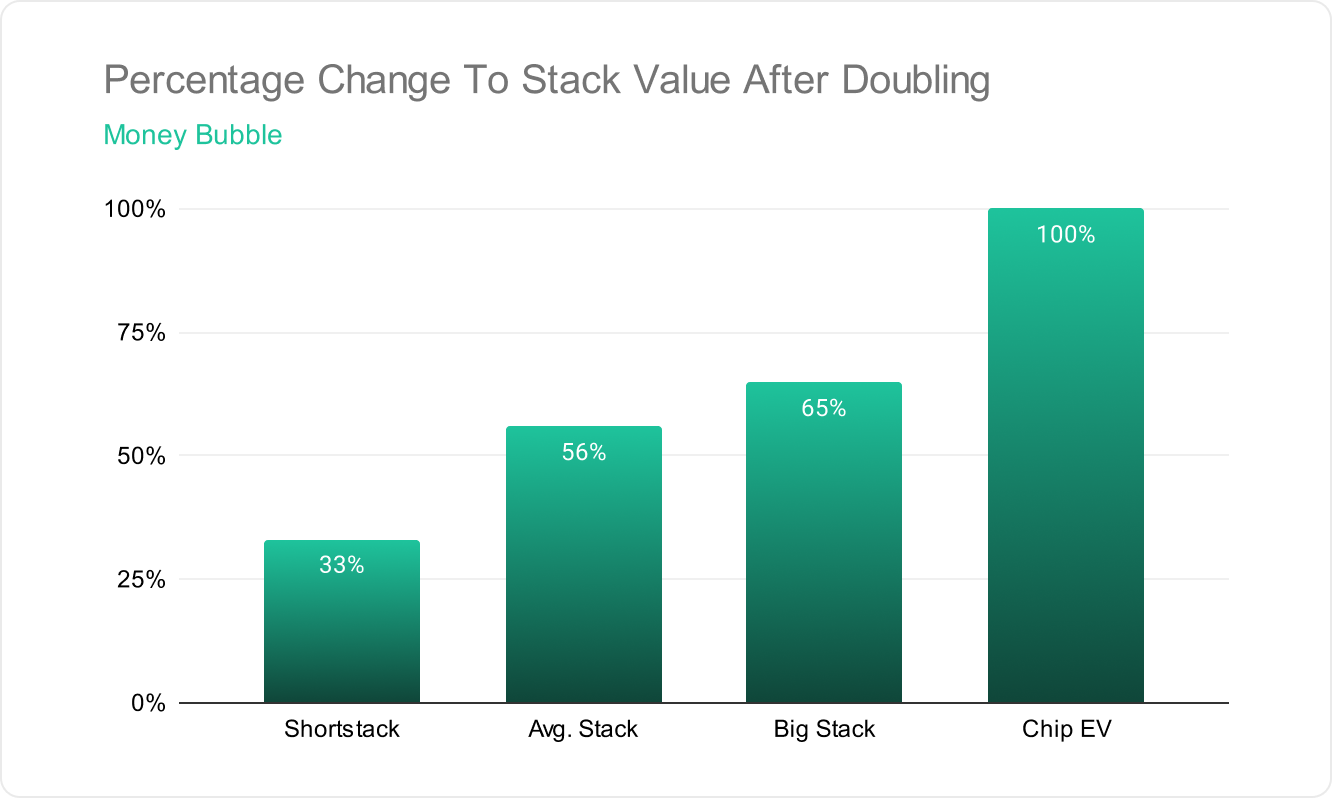
- So they risk $281.16 to gain just $93.16. To put it another way, they increase their equity by just 33%.
- An average stack had just under 7 starting stacks and was worth $722.24.
- When doubling up (to 14 starting stacks), their new equity becomes $1,126.33.
- They risked $722.24 to win $404.09, a 56% equity increase.
- A big stack with 20 starting stacks in this simulation is worth $1,440.36.
- When doubling up (to 40 starting stacks), their new equity is $2,374.70.
- They risk $1,440.36 in equity to gain $934.34, for a 65% increase in equity.
The trend that emerges at money bubbles is that the larger your stack, the more relative tournament equity you gain by doubling up.
Interpreting Tournament Equity
ICM calculations always start by estimating a player’s chance of winning the whole tournament, which is measured by their percentage of all the chips in the tournament.
Our shortest stack has 0.10% of the chips, meaning they have a 0.10% chance of winning the whole tournament. With such slim odds of winning a big prize, most of their equity in the tournament is tied up in the min-cash. Doubling does not particularly improve their chances of winning the whole event or making the final table, so their priority is survival.
If our big stack doubled, however, they would have 4% of the total chips in play, which is a very promising prospect with 151 players remaining. Doubling up puts them in a great position to make a deep run and win much bigger prizes.
Short Stacks Should Take Greater Risks To Reach the Final Table
Final Table Bubble Simulation
Let’s now look at a simulation I ran for the final table bubble in the same tournament. The winner gets $15,190, 9th gets $1,390, and the bubble boy gets $1,020.
- I gave the short stack 20 starting stacks, and that is worth $2,307.75.
- When they double, their equity becomes $3,386.60.
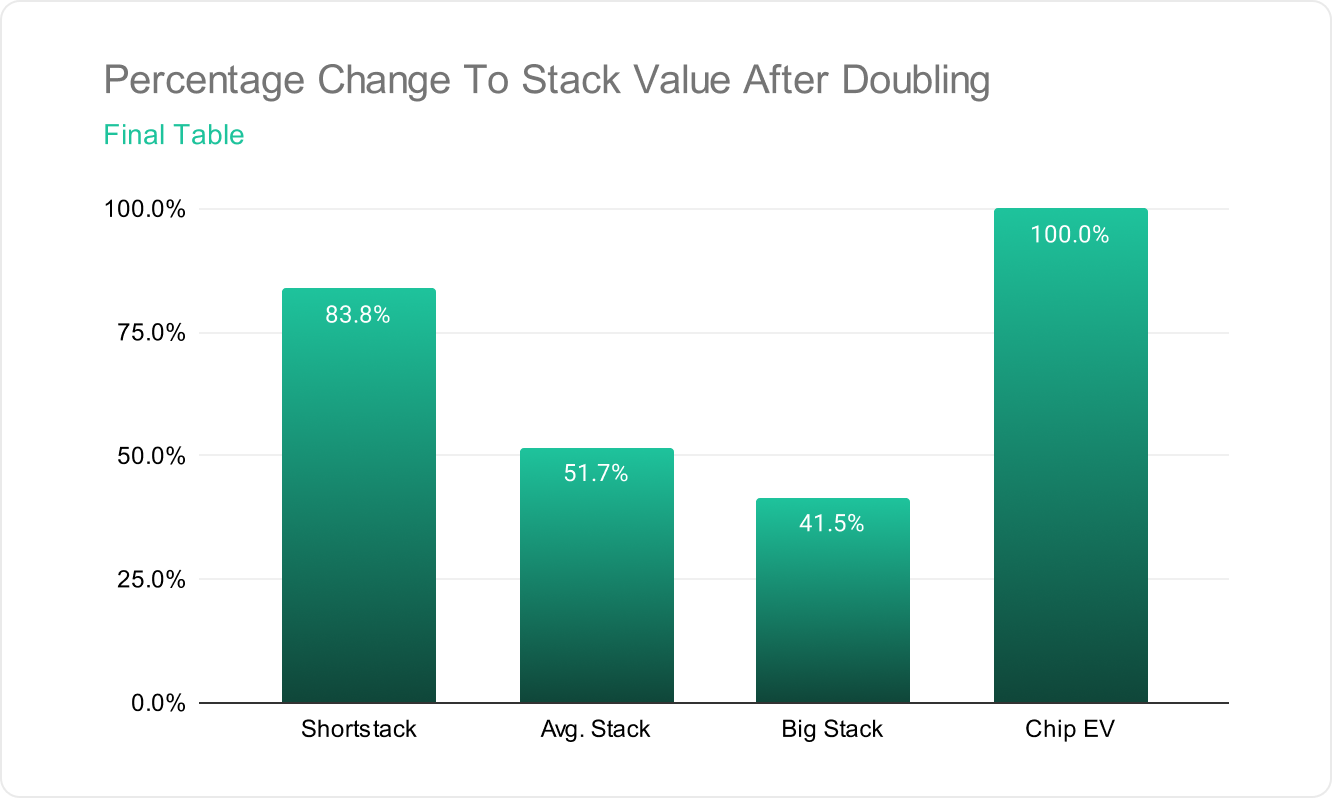
- They are risking $1,287.75 (their current $2,307.75 equity minus the locked-up 10th place prize of $1,020) to win $2,366.60 (their new $3,386.60 equity minus the locked-up 10th place prize of $1,020), a potential gain of 84%.
- The average stack has 100 starting stacks, which is worth $5,704.72,
- When they double their equity becomes $8,126.77.
- They are risking $4,684.72 (their $5,704.72 equity minus the locked-up 10th place prize of $1,020) to gain $7,106.77 (their new $8,126.77 equity minus the locked-up 10th place prize of $1,020), a potential gain of 51%.
- The 2nd chip leader has a stack of 200 starting stacks, which is worth $8,126.77.
- If they tangle with the chip leader who has 222 starting stacks and they double, their new equity becomes $11,079.23.
- They are risking $7,106.77 (their $8,126.77 equity minus the locked-up 10th place prize of $1,020) to gain $10,036 (their new $11,079.23 equity minus the locked-up 10th place prize of $1,020), a potential gain of 41%.
This is the opposite of what happened on the money bubble. The bigger your stack, the less you have to gain from doubling up.
The Big Stacks Have More To Lose at Final Tables
What is going on here? Why does ICM pressure almost flip around?
The essence of it is that the medium and big stacks have more to lose!
Our medium stack had $5,704.72 equity, which is essentially 4th place money. If they punted, they would not only be throwing away that particular prize but also their chance of coming first, second, third, and so on.
The other significant factor here is that the upside of the bigger stacks is capped. No matter how many more chips they win, they cannot win a bigger prize than the first prize ($15,190). When our chip leader had 40% of the chips in play, their tournament equity was $11,079.23. Even when I gave them 99% of the chips, their equity only went up to $15,147.43. There is just less upside to justify taking a big risk.
However, when we contrast that with the short stack, there is a lot of upside to doubling up. They have already secured themselves the 10th place prize ($1,020). So, there is no risk of going broke in that regard, but doubling up harbors a great reward (worth an 84% equity increase). Don’t get me wrong, though. They still have ICM pressure on them, but relative to the bigger stacks, they have “nothing” to lose and “everything” to gain.
Small vs Large Field Money Bubbles
One category of spots where the above is not quite true is when the money bubble is in a small field event.
In the following two spots, the chip distribution on the table is identical.
Impact of Field Size on Money Bubble Factors
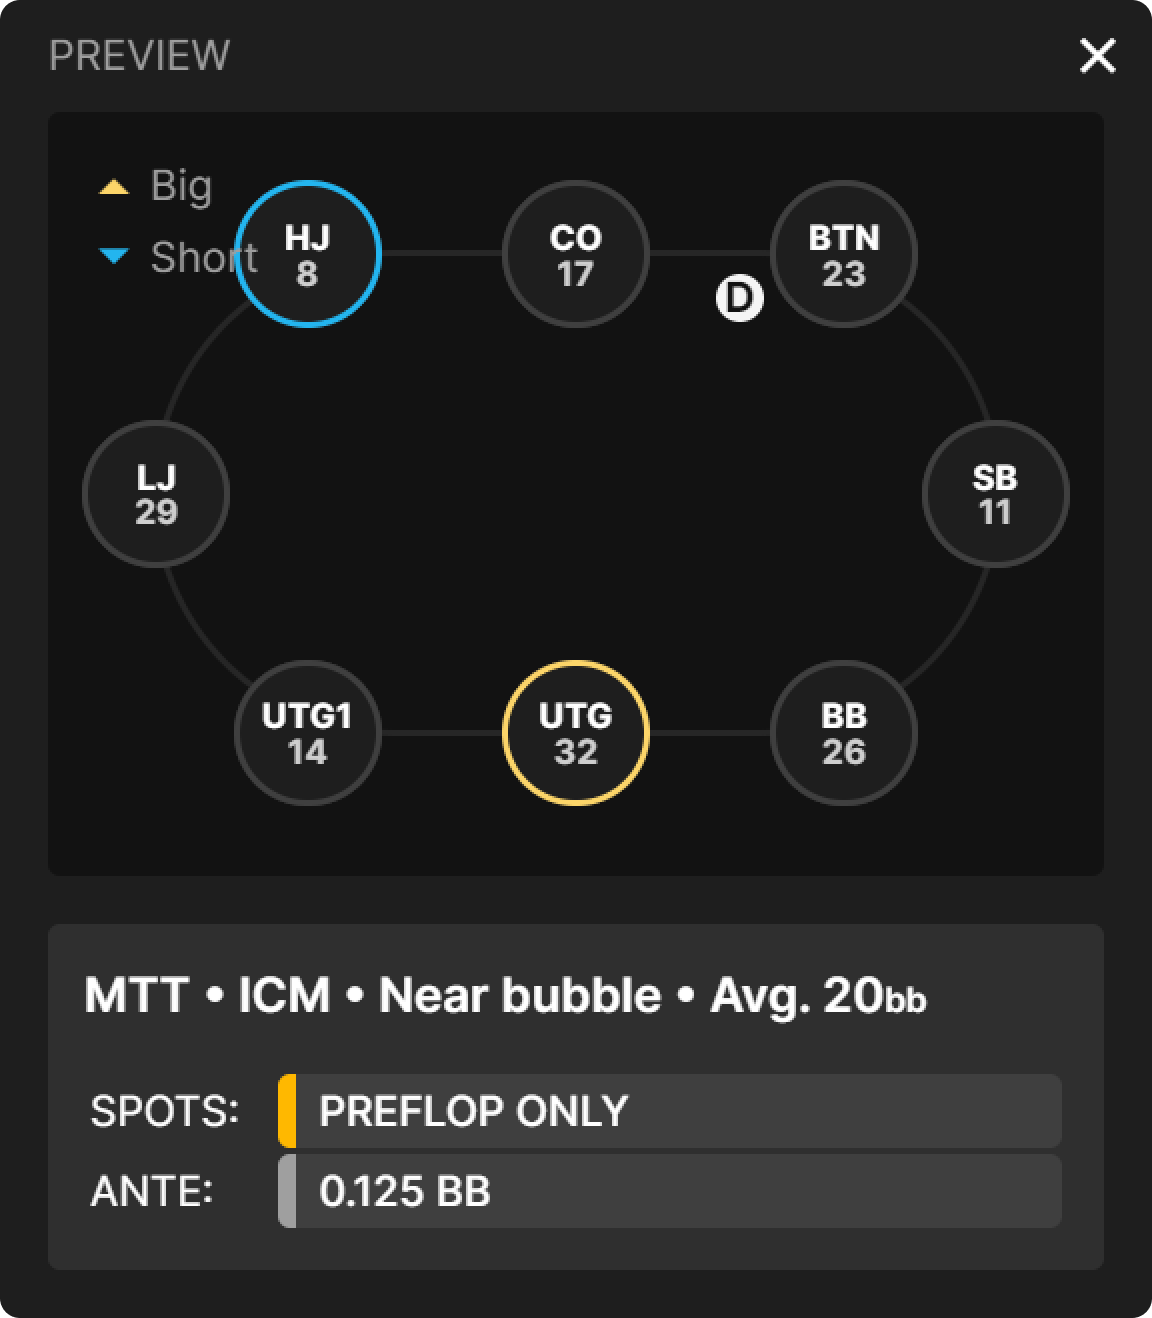
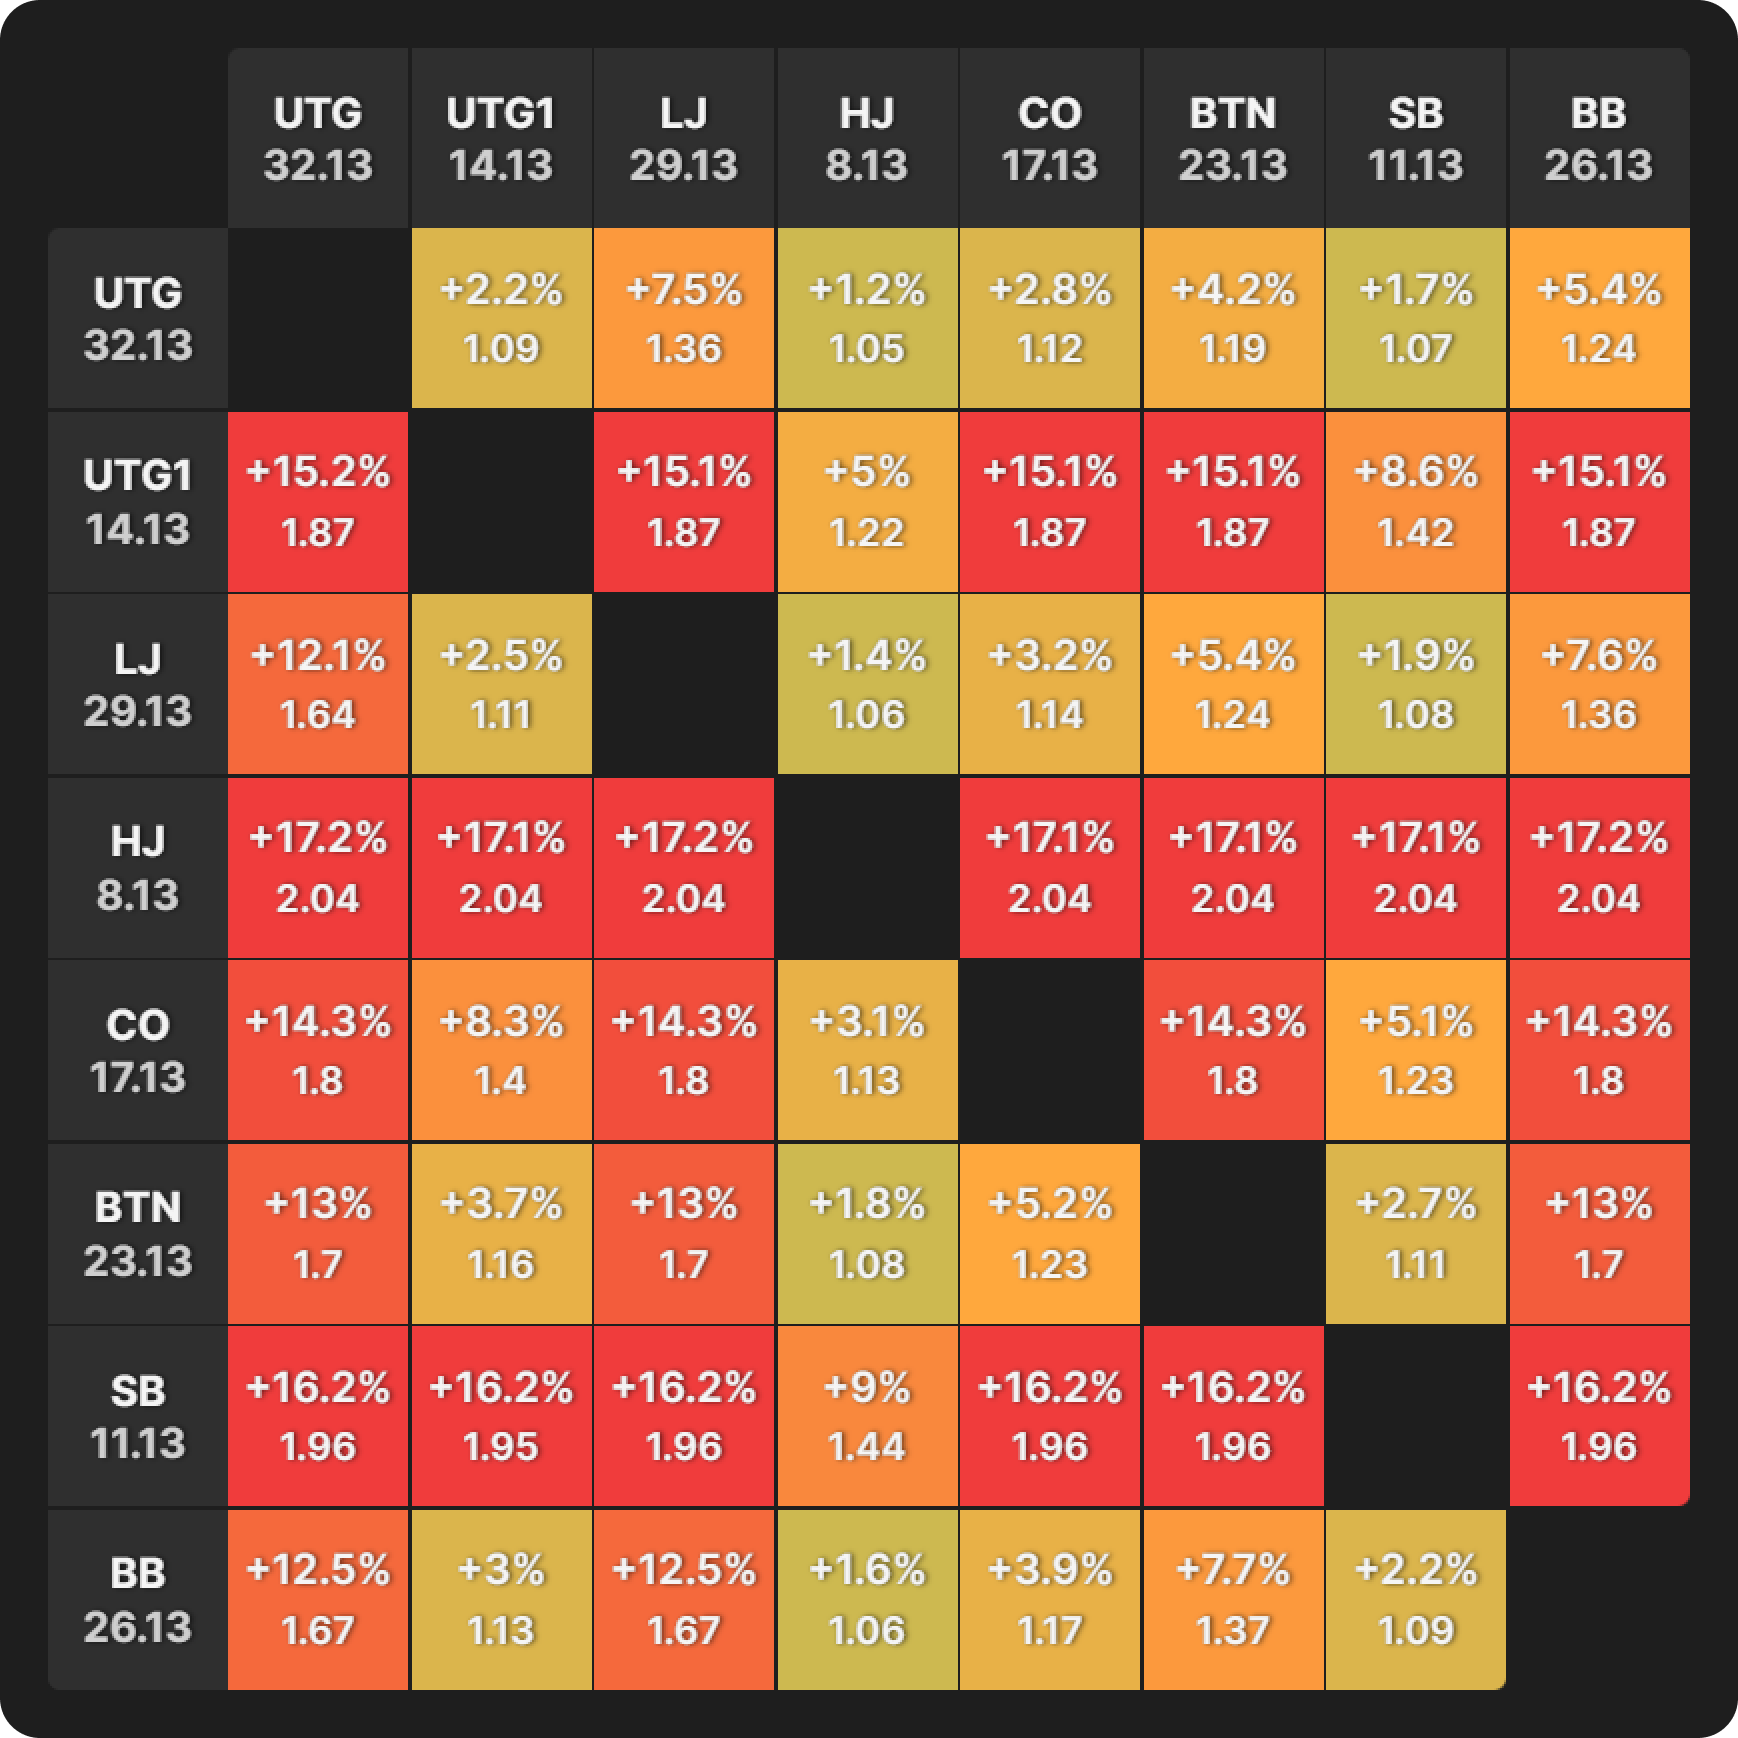
This is the money bubble in a tournament with 1,000 runners (150 paid), with the following bubble factors:
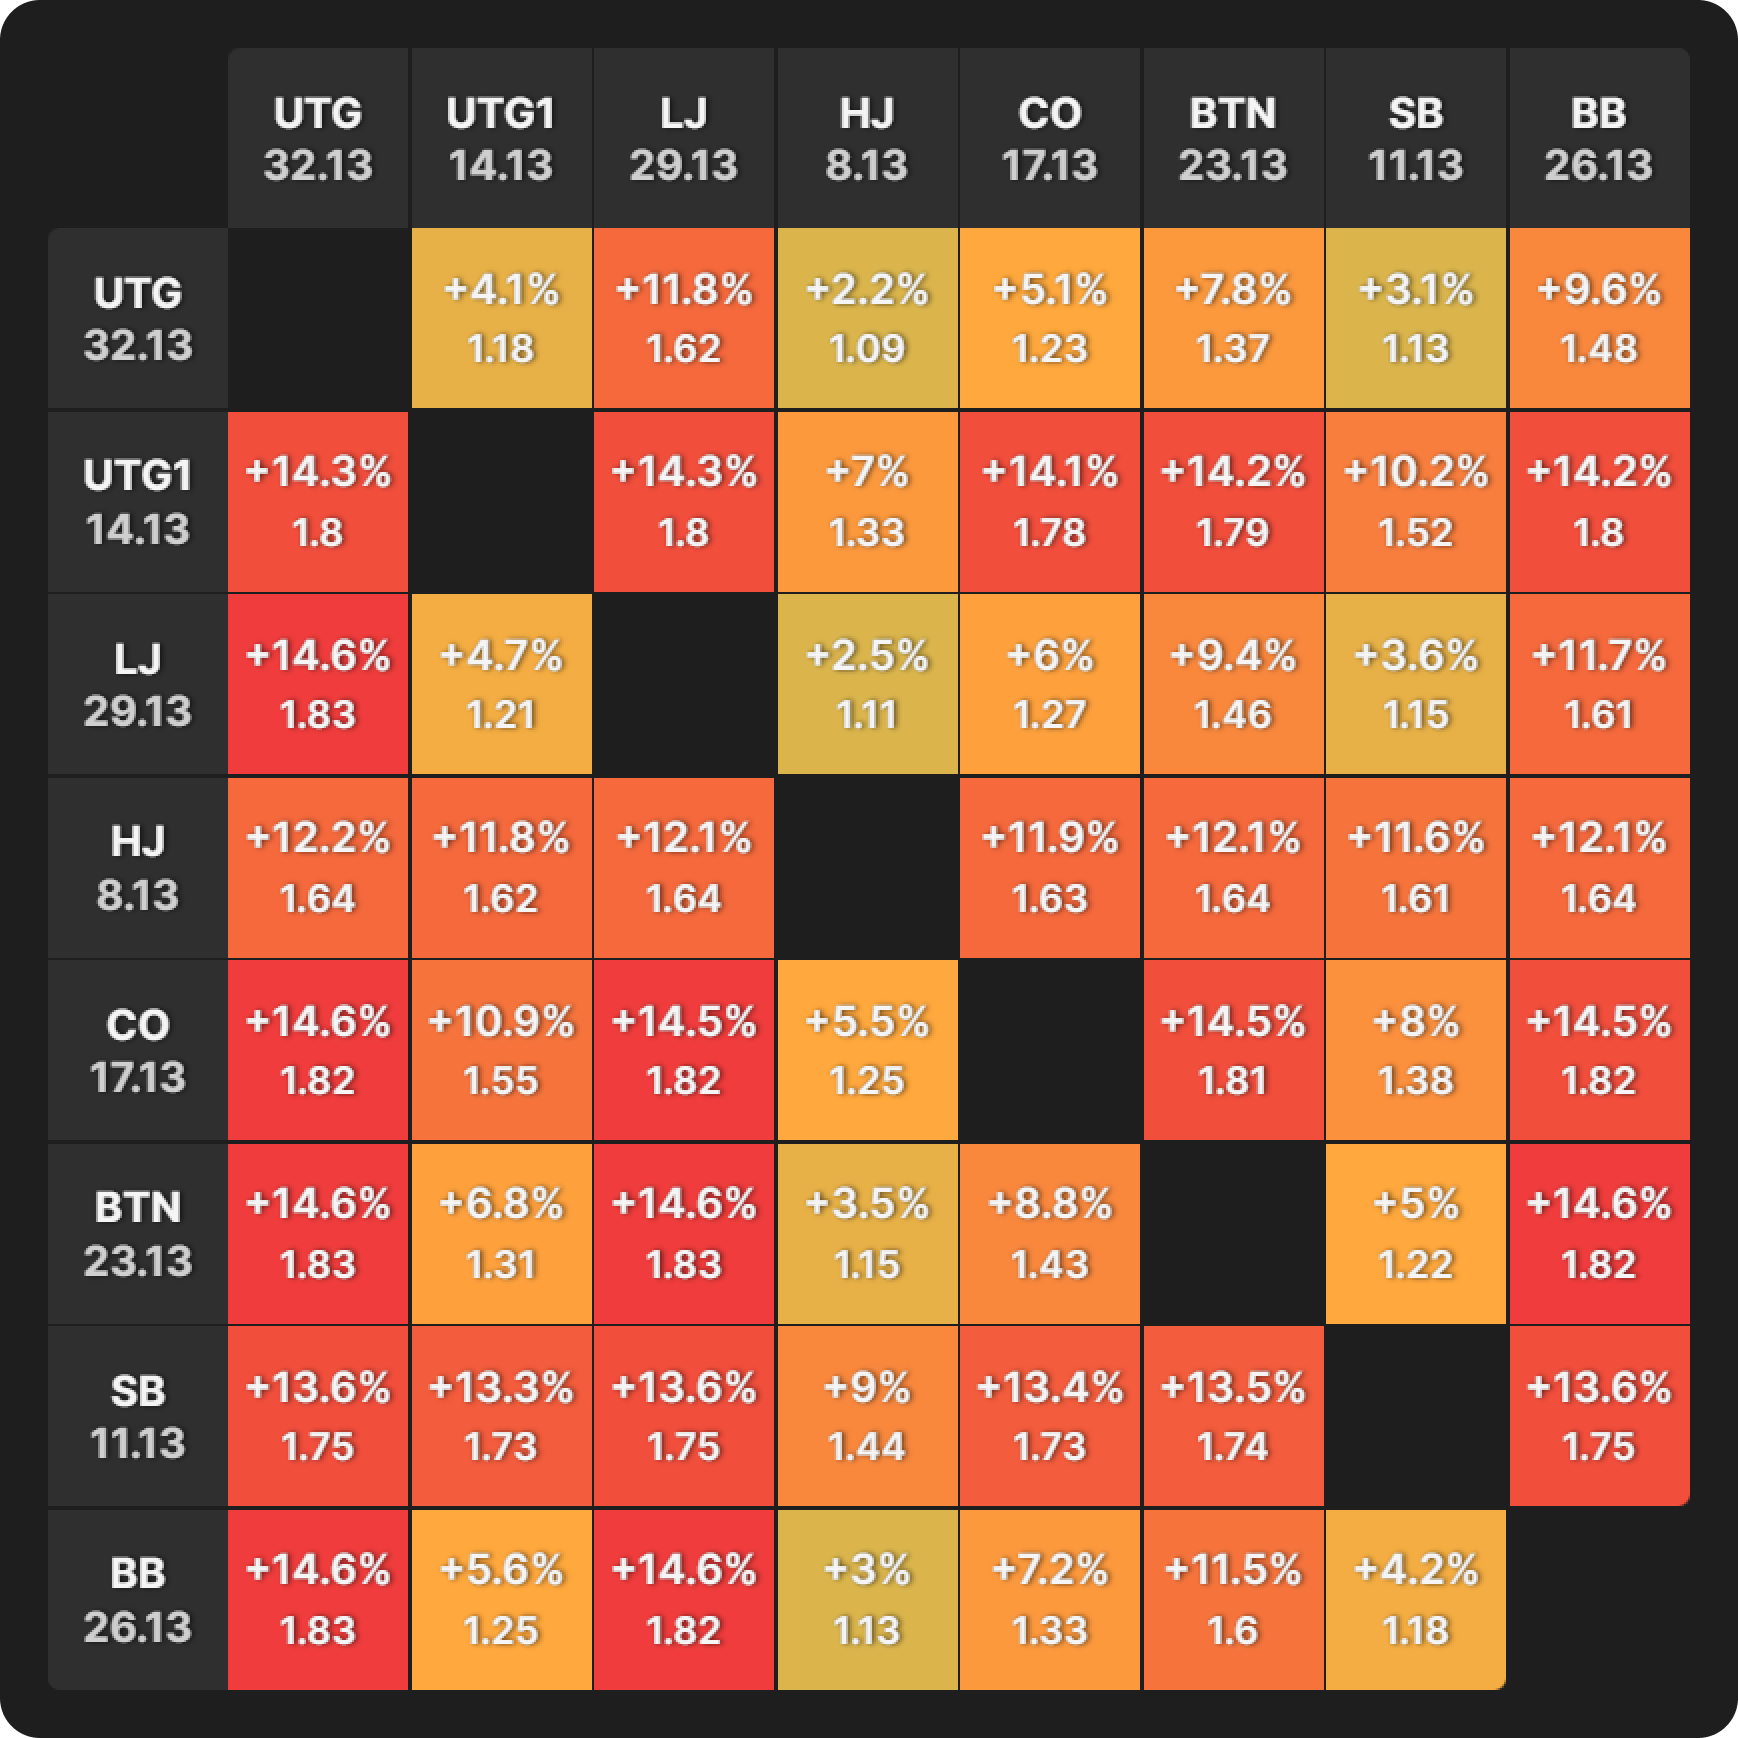
This is the same spot, but the money bubble takes place in a tournament with 200 runners (30 paid):
At first glance, they look quite similar. However, further inspection of our short stack (the HJ with 8bb) reveals a nuance. In the 1,000-runner example, their bubble factor is 2.04 across the board, the highest at the table. In the 200-runner example, their bubble factor lowered to 1.64 in most spots.
The BTN is the middle stack with 23bb. Their bubble factor peaks at 1.7 in the 1,000-runner example but goes as high as 1.83 in the 200-runner scenario. This is the highest bubble factor of all.
The chip leader is UTG with 32bb. Their bubble factor gets as high as 1.36 in the 1,000-runner example, it goes as high as 1.62 in the 200-runner scenario.
In a smaller field, the money bubble looks much more like the final table bubble.
In practical terms, this means that the short stacks can play looser, while the medium to large stacks have to play more cautiously.
This effect on the strategies is caused by the money bubble occurring much closer to the final table bubble. Reaching the final table is a much more likely prospect for everyone in a small-field tournament than in a big-field MTT. The short stacks, therefore, have less of their equity tied up in the min-cash.
Conclusion
The money and final table bubbles are the two most extreme ICM situations in a classic tournament. They are similar in severity but different in who experiences the most pressure.
Money Bubble
The money bubble puts the most pressure on short stacks, for whom making the money is usually their only realistic prospect. Larger stacks should not concern themselves as much about min-cashing because they do have a realistic shot of making the final table and its prizes.
Final Table Bubble
The final table bubble is the opposite. A medium to large stack is most pressurized because they have “everything” to lose and much less to gain by taking a big risk on the FT bubble. A short stack, however, has a lot to gain by taking some risks. There is much more upside for the short stacks on final table bubbles.
Field size is a massive consideration in this respect. On money bubbles, the closer everyone already is to the final table, the closer the strategy resembles a final table bubble.
The BB’s incentives for calling an SB preflop raise differ from those of a cold-caller facing a raise from, say, LJ or CO. And the SB’s incentives for raising differ from those of an open-raiser in any other position.
Author
Barry Carter
Barry Carter has been a poker writer for 16 years. He is the co-author of six poker books, including The Mental Game of Poker, Endgame Poker Strategy: The ICM Book, and GTO Poker Simplified.
Wizards, you don’t want to miss out on ‘Daily Dose of GTO,’ it’s the most valuable freeroll of the year!
We Are Hiring
We are looking for remarkable individuals to join us in our quest to build the next-generation poker training ecosystem. If you are passionate, dedicated, and driven to excel, we want to hear from you. Join us in redefining how poker is being studied.
