Money Bubble vs Final Table Bubble

Is one bubble the same as another? Should we play more conservatively on the money bubble of a small-field tournament, a large-field one, or the final table bubble? Are there nuances based on the makeup of the event itself?
In several of the articles that I have written so far on the topic of ICM, the below image makes an appearance because it is so illustrative. It is a graph of the average bubble factor of the average player at different stages of Pokerstars’ flagship Sunday tournament: the Sunday Million. It’s from the (nearly twenty years old) book ‘Kill Everyone‘ (2007).
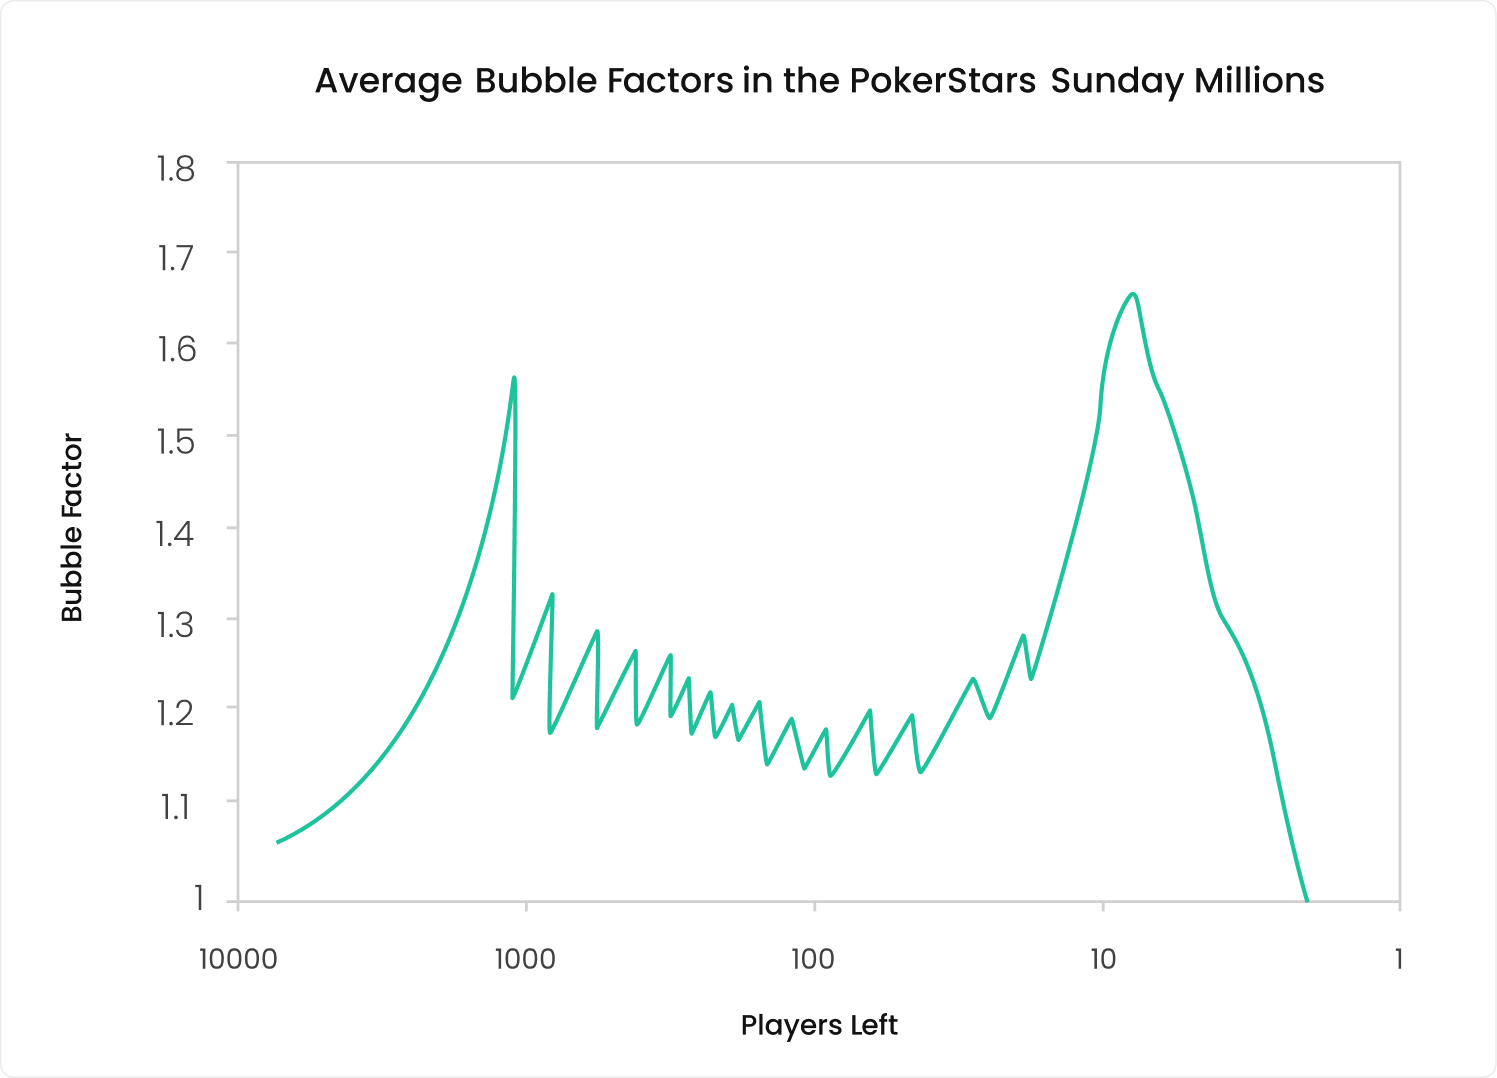
What (literally) stands out most from the graph is that the average bubble factor peaks a first time on the money bubble. A second peak coincides with the final table bubble, dropping sharply with each elimination. The final table bubble being more extreme than the money bubble surprises some people, but it makes sense because making the final table puts you in a position to win the biggest prizes of the tournament.
When people learn about this, they may come to the conclusion that the strategies for money (ITMIn the money
Any finish in a poker tournament where the player has won money for their placement. Also known as “having cashed”. Often abbreviated to ITM.) bubbles and final table (FTFinal Table
The last table remaining in a poker tournament. Often, people use the abbreviation FT to refer to it.) bubbles are the same, but this is not quite the case. Significant differences exist between the bubbles that form at these two key events of a multi-table tournament.
Same Chip Distribution, Different Bubbles
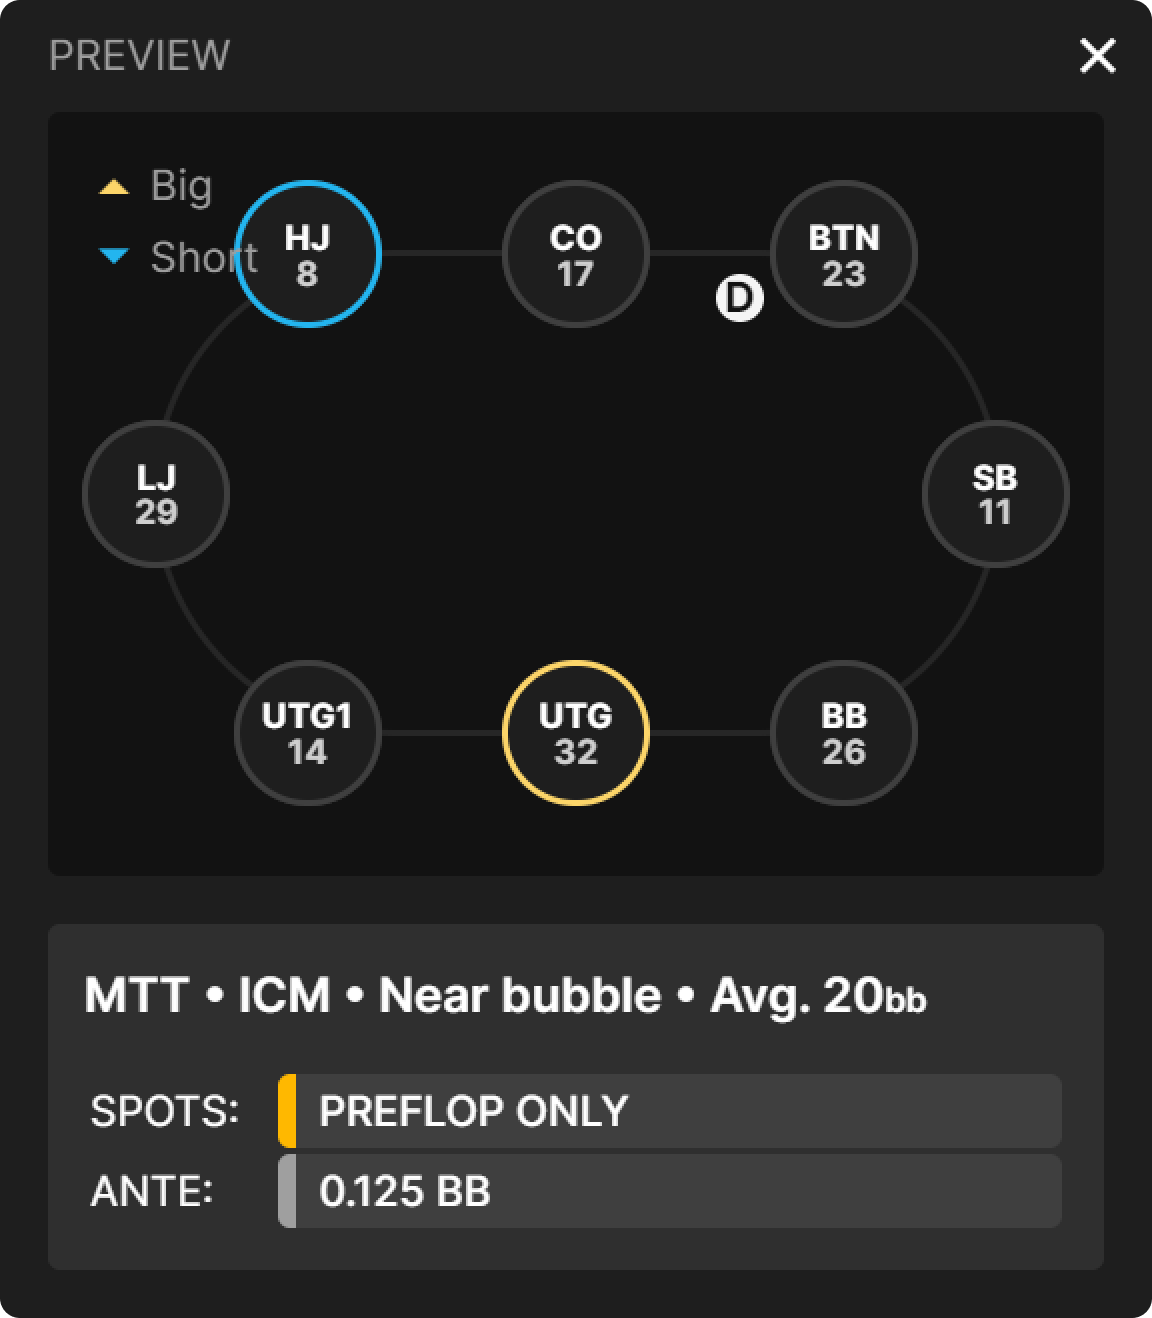
Let’s explore some carefully selected spots to get to the heart of the difference between these bubbles. Both spots feature the same chip distribution. The stack sizes at the table are as follows:
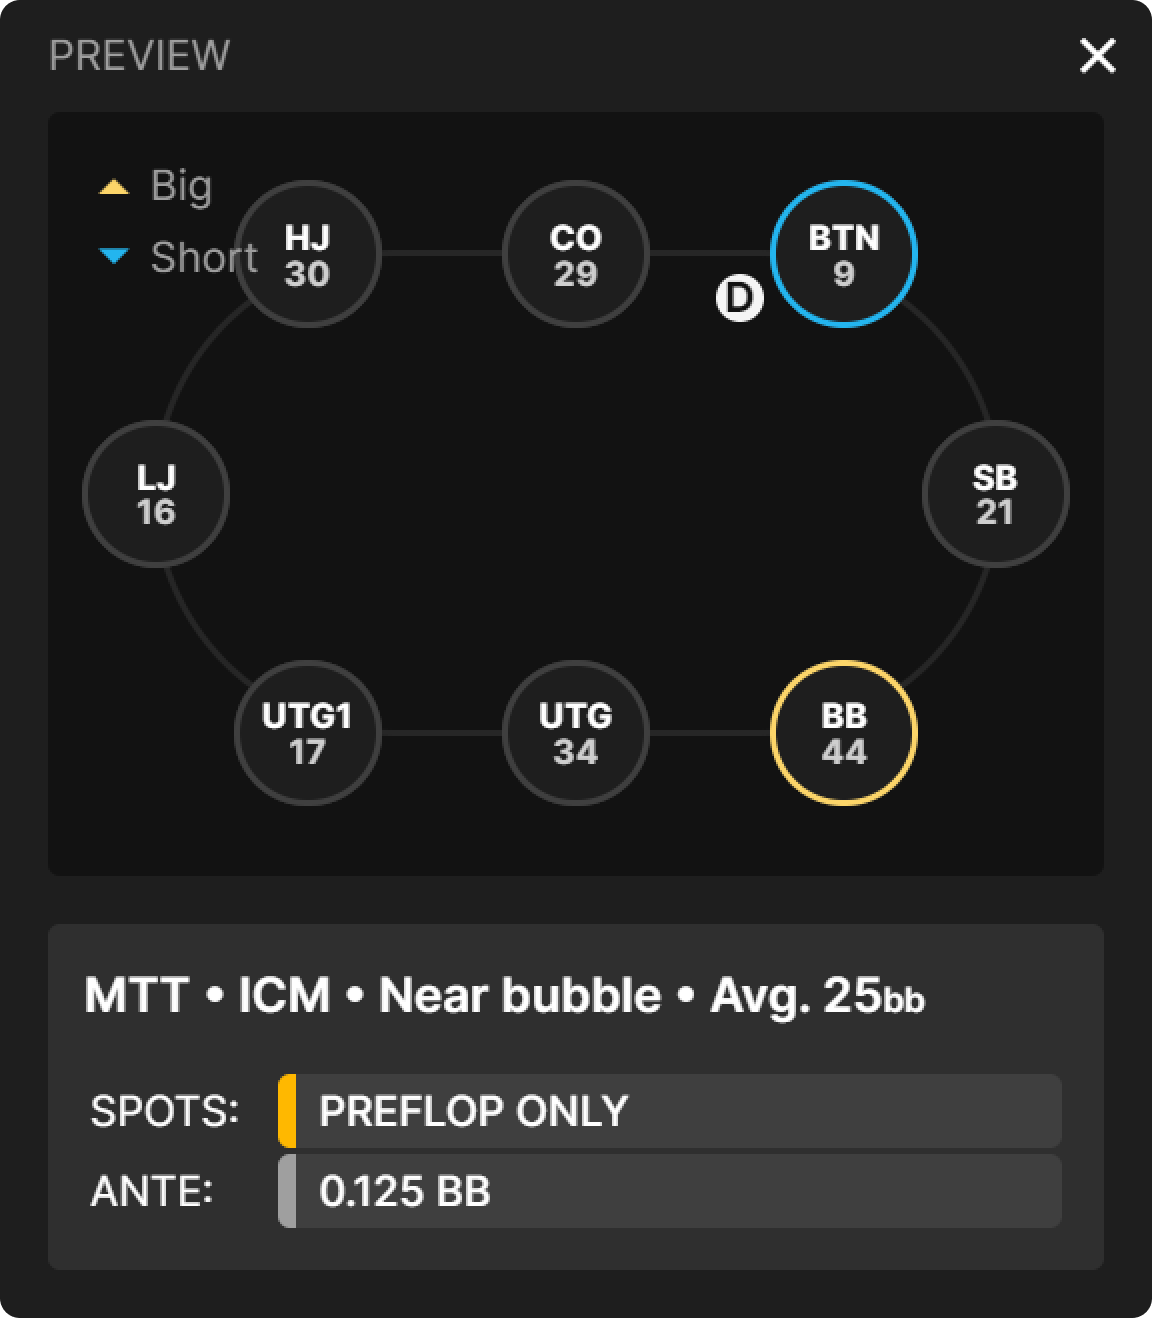
As you can see, we have a mix of stacks. Focusing on the ones in the three latest positions, we find that the BTN is the short stack with 9bb, the SB is the medium stack with 21bb, and the BB is the big stack with 44bb.
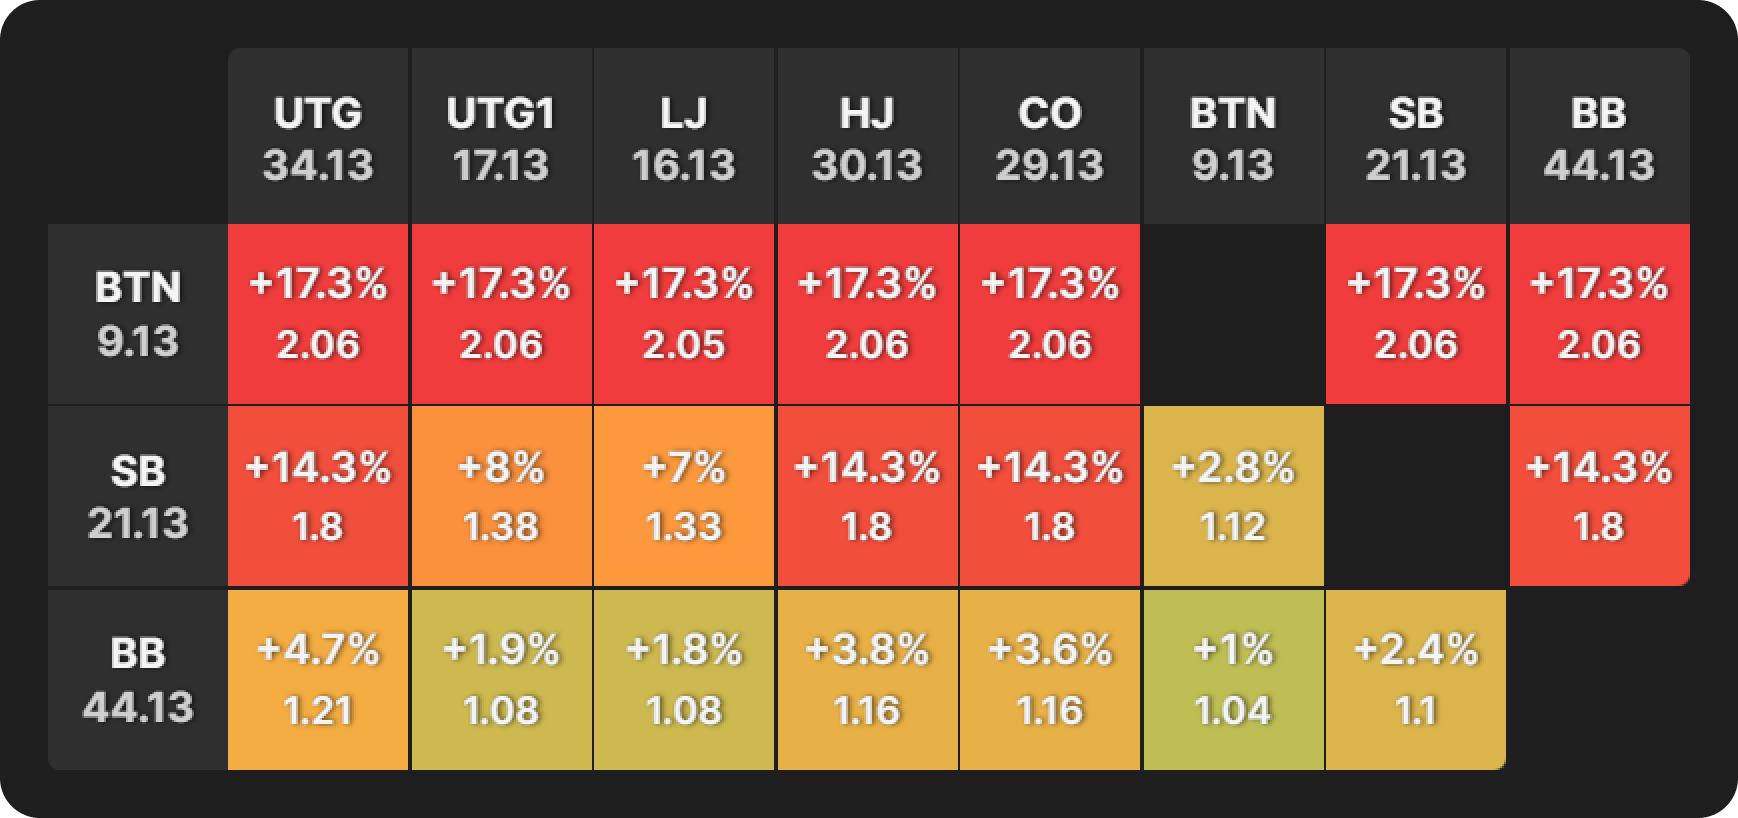
These are the bubble factors for this spot when the stage of the tournament = the money bubble.
I have cropped the bubble factor table to isolate the last three players, who conveniently have the smallest, middling, and largest stacks.
Let’s interpret this table one row at a time.
- Smallest stack: The BTN is under extremely heavy ICM pressure. The bubble factor is constant regardless of the opponent; it is 2.06, which means we need 17.3% extra equity to justify getting involved in the pot and potentially stacking off.
- Middling stack: The SB experiences moderate to heavy ICM pressure on them, mostly depending on whether they are covered or not. When covered, their bubble factor is 1.8, but it can be as low as 1.12 against the BTN.
- Largest stack: The BB has barely any ICM pressure on them. Against the BTN, it is 1.04, which is basically Chip EV. It’s still quite low, even against UTG, the second chip leader, at 1.21.
Now, let’s admire the bubble factors of the same spot in terms of chip distribution but different in terms of the stage of the tournament = final table bubble.
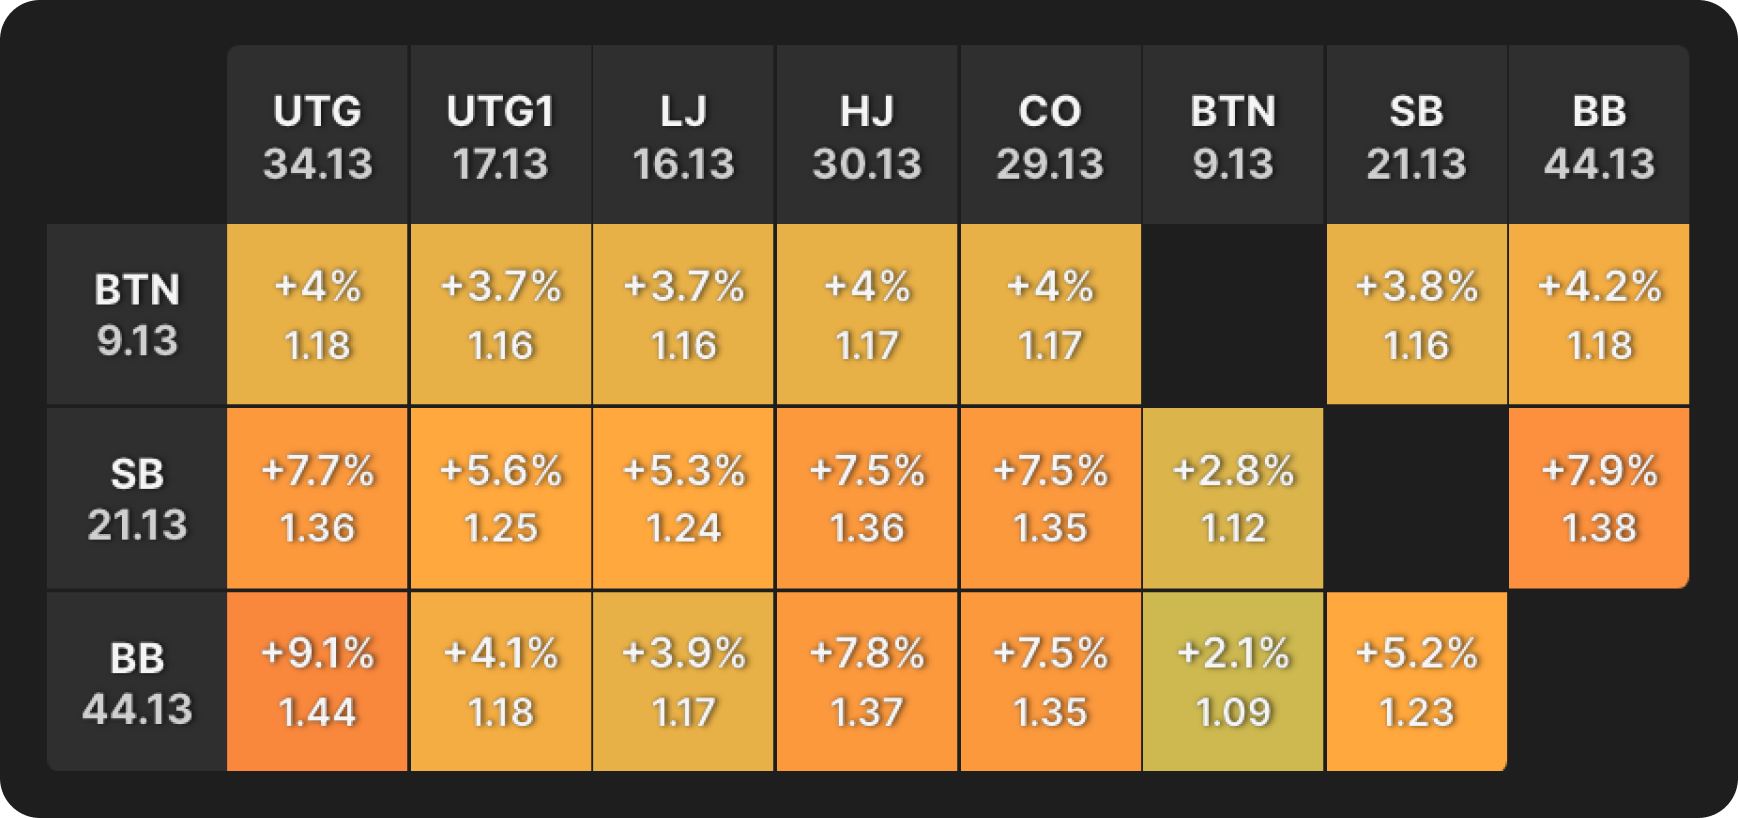
Round 2 of bubble factor table analysis.
- Smallest stack: The BTN has gone from extreme ICM pressure to very little. With a bubble factor peak at 1.18, which is almost as low as the chip leader had in the last example.
- Middling and largest stacks: The ICM pressure is now on our medium and big stacks. It’s not as suffocating as it was for the short stack on the money bubble, but it is much greater than it is for the short stack now, at the final table bubble.
- Largest stacks: In fact, the highest bubble factor we see is when the BB goes up against UTG, in what is a chip leader vs second chip leader battle. In that confrontation, the chip leader (BB) has a bubble factor of 1.44, indicating they need an additional 9.1% equity to call an all-in from the second chip leader (UTG).
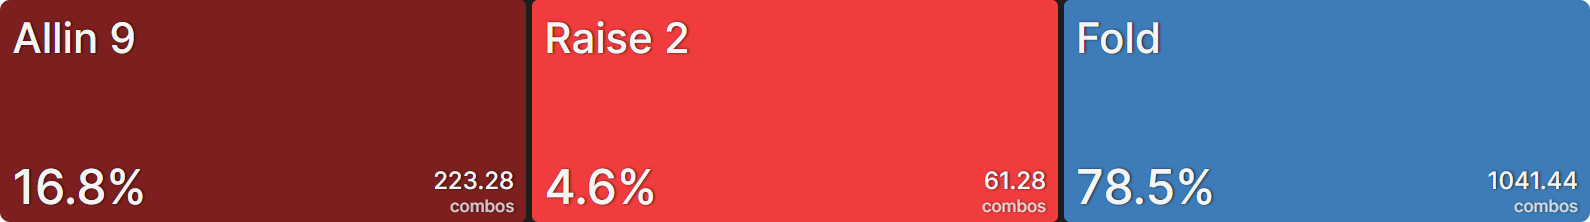
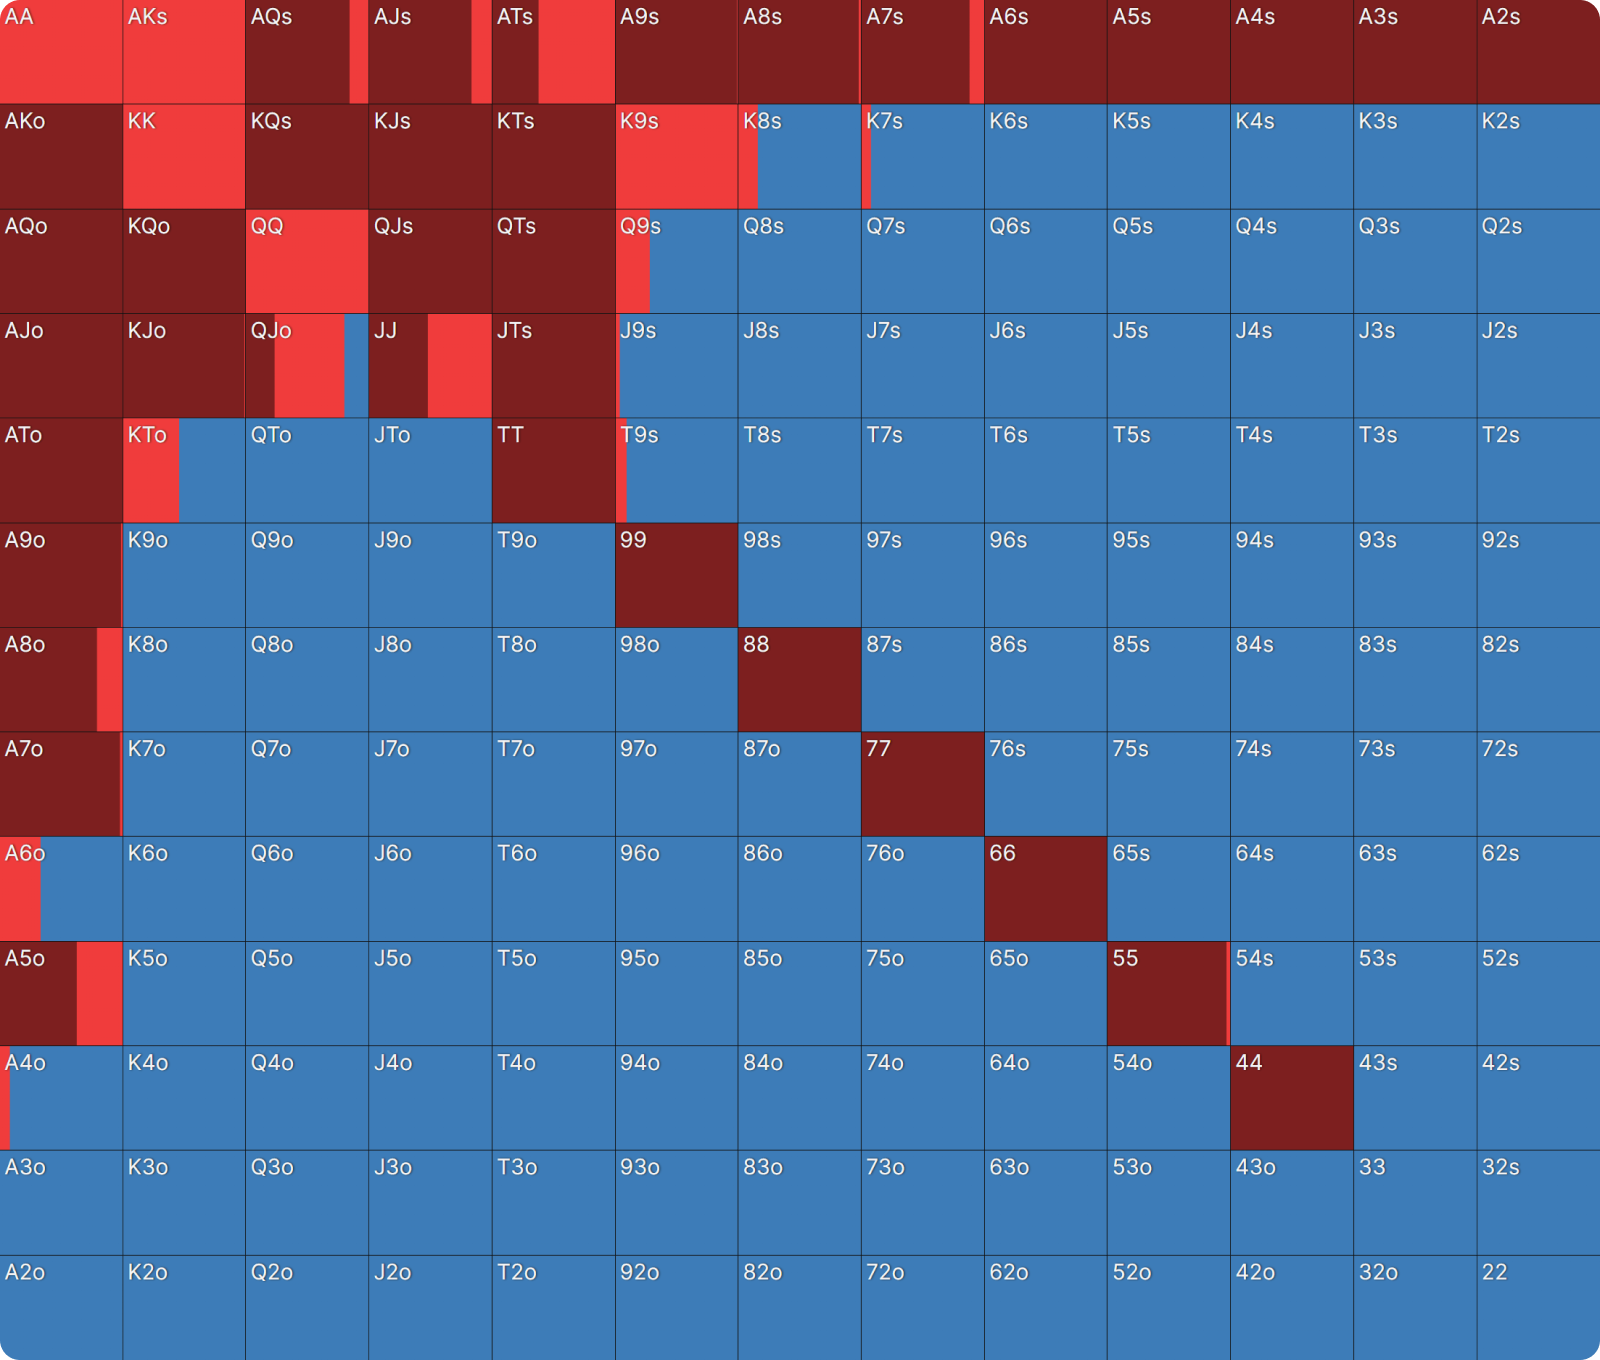
We can see this reflected in the strategies. Here we have BTN’s opening strategy on the ITM bubble:
And this is the same spot on the FT bubble:
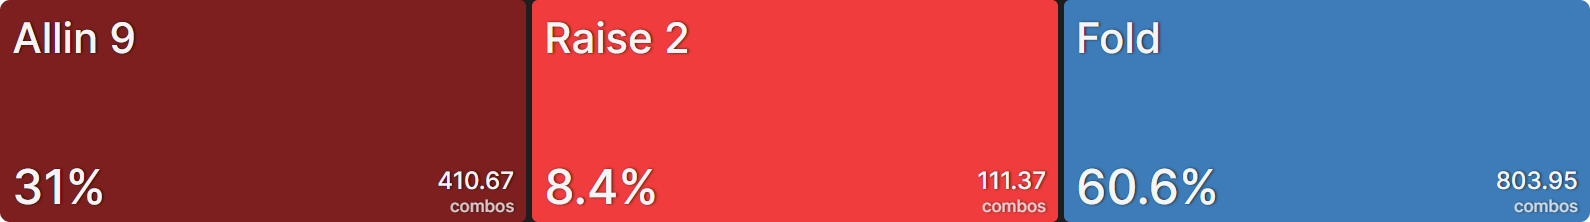
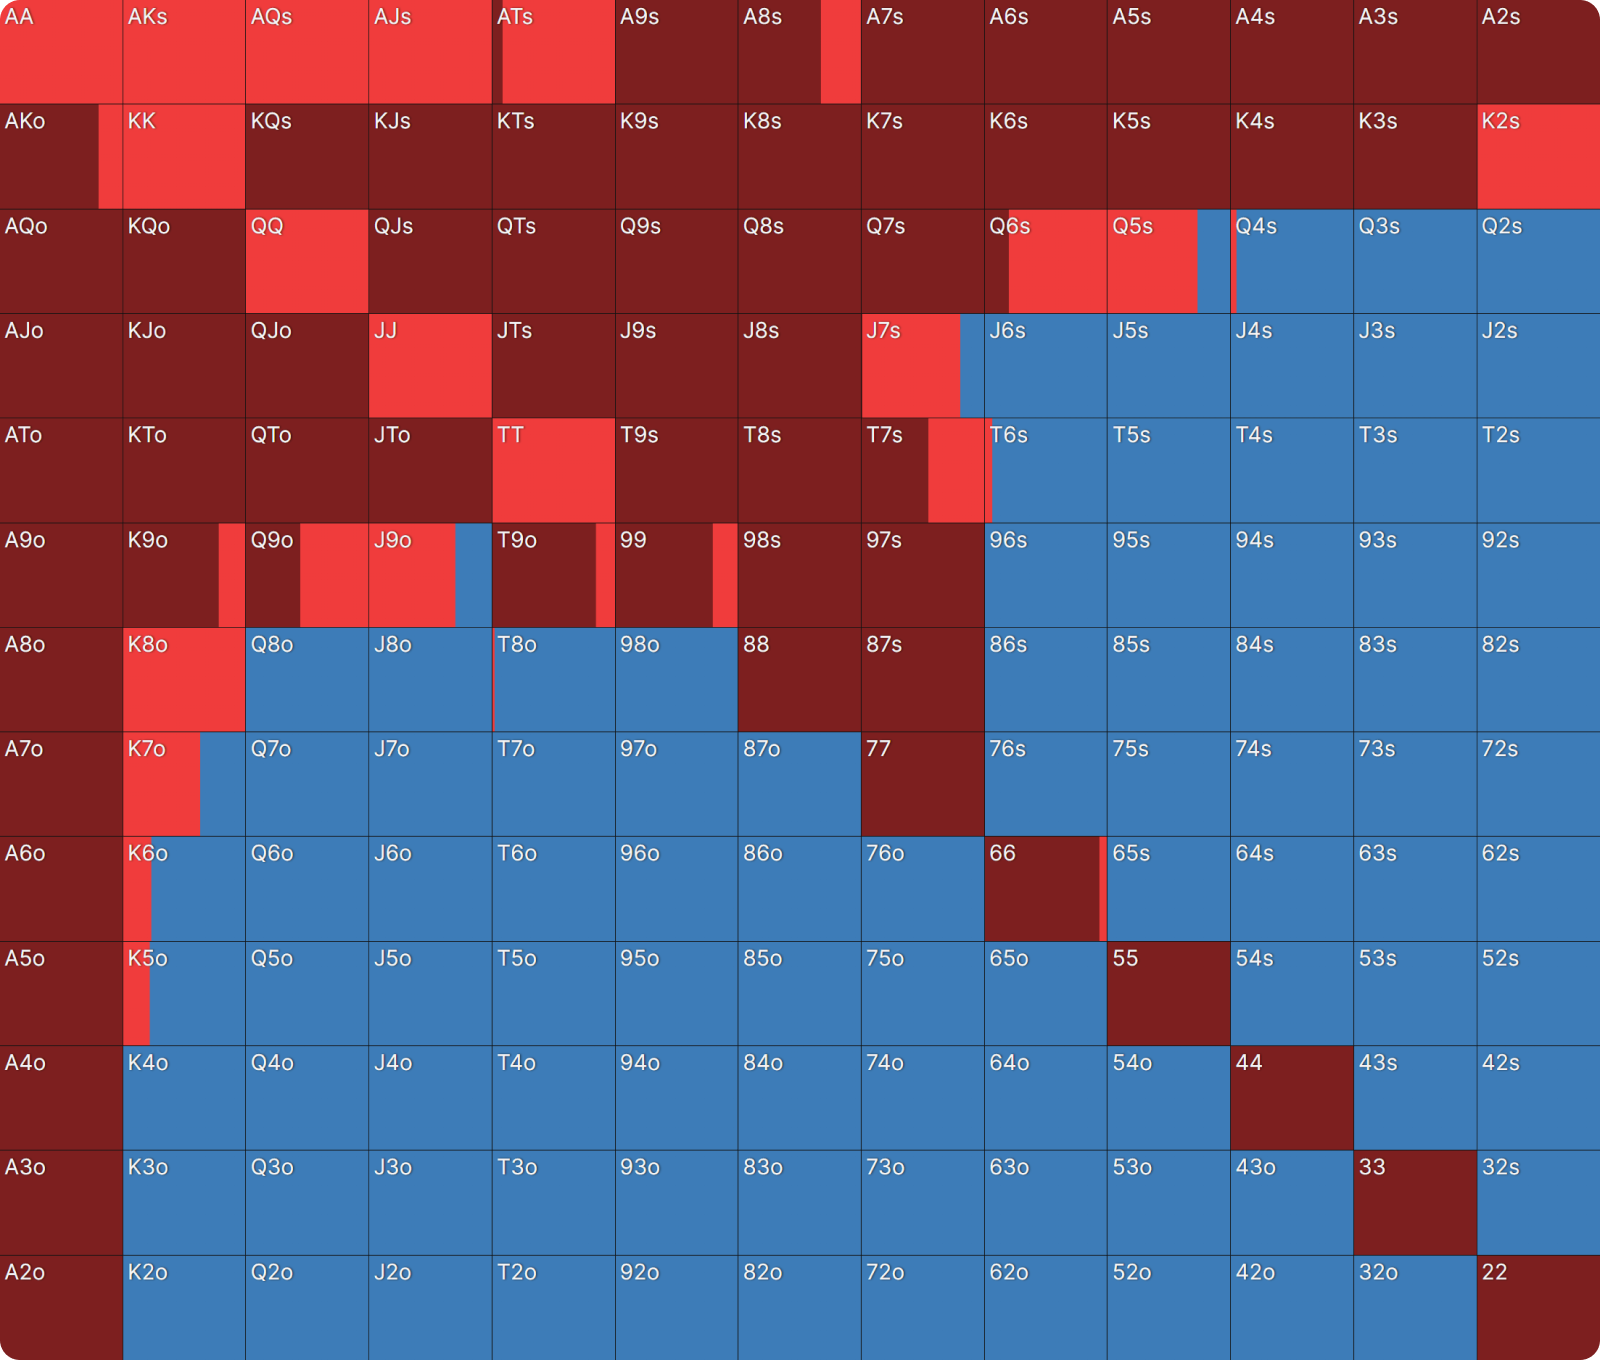
The BTN’s range has essentially doubled. In both spots, they are most at risk of elimination, but they are more incentivized to survive on a money bubble compared to on a final table bubble, where they are encouraged to be more ambitious. They become relatively bolder in their strategy, looking for a double-up to get them back in the game and fight for higher-up prizes, maybe even ‘play for the win’ again.
Short Stacks Should Prioritize Min-Cashing
Tournament Simulation
To show you what is happening here, I simulated a tournament using this free “MTT ICM Calculator” tool from our colleagues at HoldemResources Calculator. The payout structure is based on the ICM sims with 1,000 runners that can be found in the GTO Wizard solution library. To keep it simple, I made it a $100 rake-free buy-in, amounting to a $100,000 prize pool, which reserves 15.19% of it ($15,190) for the winner.
Money Bubble Simulation
The last 15% of runners in the tournament (150) get paid, and I simulated a bubble with a wide mix of stacks. You can see the outputs here.
- In this example, our shortest-stacked player had one starting stack,
- Their tournament equity was $281.16. The min-cash in this tournament was $200.
- When doubling up (to two starting stacks), their new tournament equity becomes $374.32.
- So they risk $281.16 to gain just $93.16. To put it another way, they increase their equity by just 33%.
- An average stack had just under 7 starting stacks and was worth $722.24.
- When doubling up (to 14 starting stacks), their new equity becomes $1,126.33.
- They risked $722.24 to win $404.09, a 56% equity increase.
- A big stack with 20 starting stacks in this simulation is worth $1,440.36.
- When doubling up (to 40 starting stacks), their new equity is $2,374.70.
- They risk $1,440.36 in equity to gain $934.34, for a 65% increase in equity.
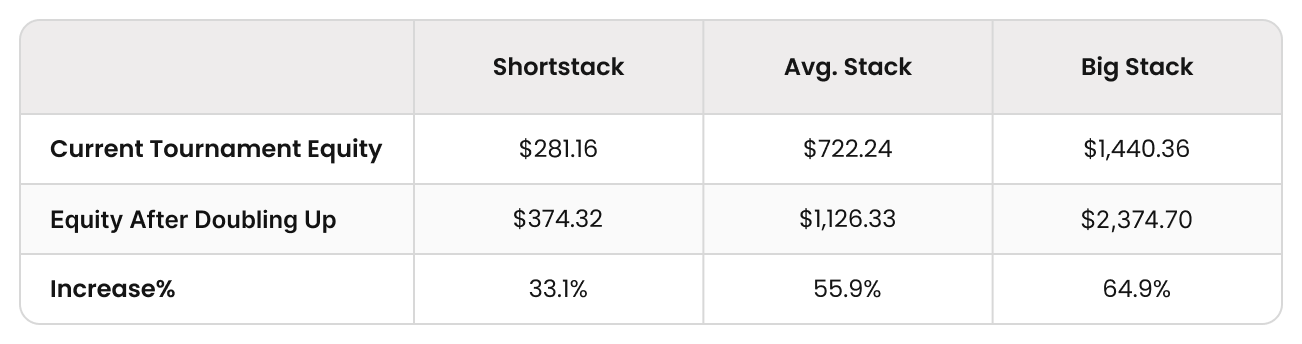
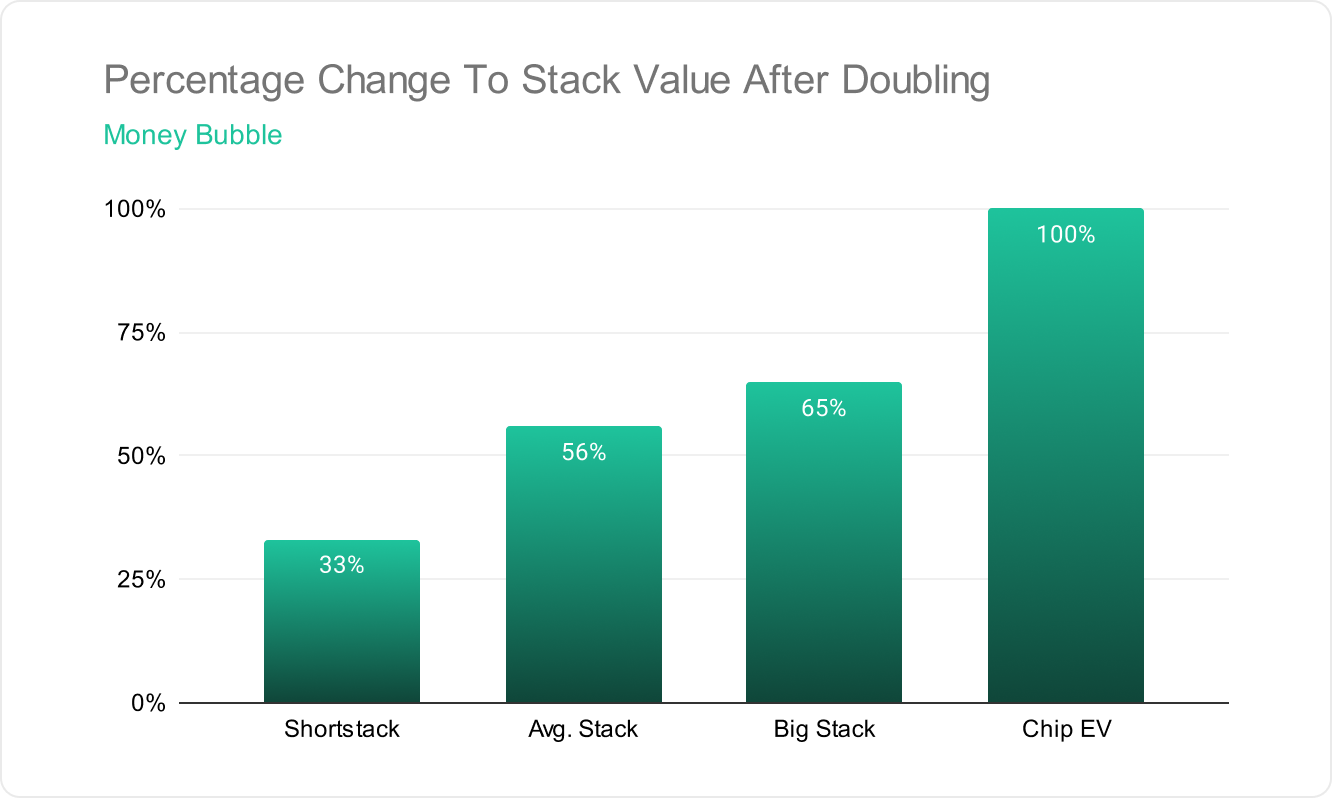
The trend that emerges at money bubbles is that the larger your stack, the more relative tournament equity you gain by doubling up.
Interpreting Tournament Equity
ICM calculations always start by estimating a player’s chance of winning the whole tournament, which is measured by their percentage of all the chips in the tournament.
Our shortest stack has 0.10% of the chips, meaning they have a 0.10% chance of winning the whole tournament. With such slim odds of winning a big prize, most of their equity in the tournament is tied up in the min-cash. Doubling does not particularly improve their chances of winning the whole event or making the final table, so their priority is survival.
If our big stack doubled, however, they would have 4% of the total chips in play, which is a very promising prospect with 151 players remaining. Doubling up puts them in a great position to make a deep run and win much bigger prizes.
Short Stacks Should Take Greater Risks To Reach the Final Table
Final Table Bubble Simulation
Let’s now look at a simulation I ran for the final table bubble in the same tournament. The winner gets $15,190, 9th gets $1,390, and the bubble boy gets $1,020.
- I gave the short stack 20 starting stacks, and that is worth $2,307.75.
- When they double, their equity becomes $3,386.60.
- They are risking $1,287.75 (their current $2,307.75 equity minus the locked-up 10th place prize of $1,020) to win $2,366.60 (their new $3,386.60 equity minus the locked-up 10th place prize of $1,020), a potential gain of 84%.
- The average stack has 100 starting stacks, which is worth $5,704.72,
- When they double their equity becomes $8,126.77.
- They are risking $4,684.72 (their $5,704.72 equity minus the locked-up 10th place prize of $1,020) to gain $7,106.77 (their new $8,126.77 equity minus the locked-up 10th place prize of $1,020), a potential gain of 51%.
- The 2nd chip leader has a stack of 200 starting stacks, which is worth $8,126.77.
- If they tangle with the chip leader who has 222 starting stacks and they double, their new equity becomes $11,079.23.
- They are risking $7,106.77 (their $8,126.77 equity minus the locked-up 10th place prize of $1,020) to gain $10,036 (their new $11,079.23 equity minus the locked-up 10th place prize of $1,020), a potential gain of 41%.
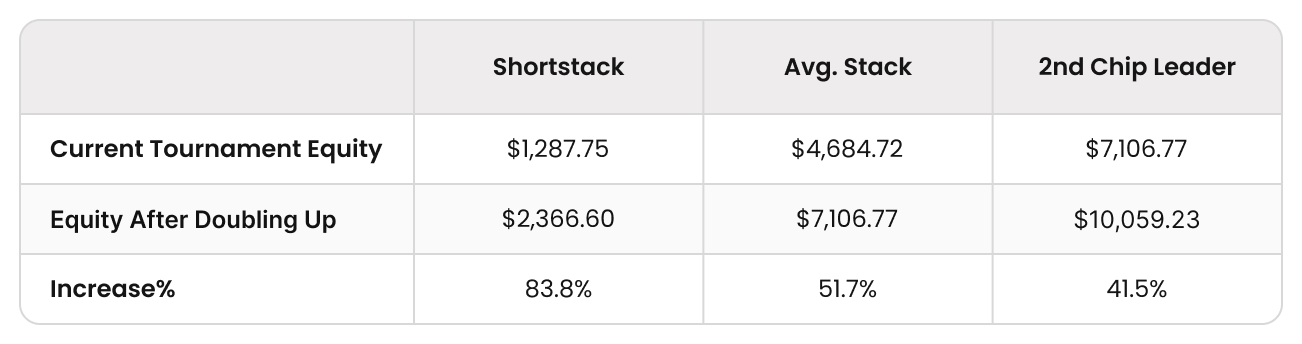
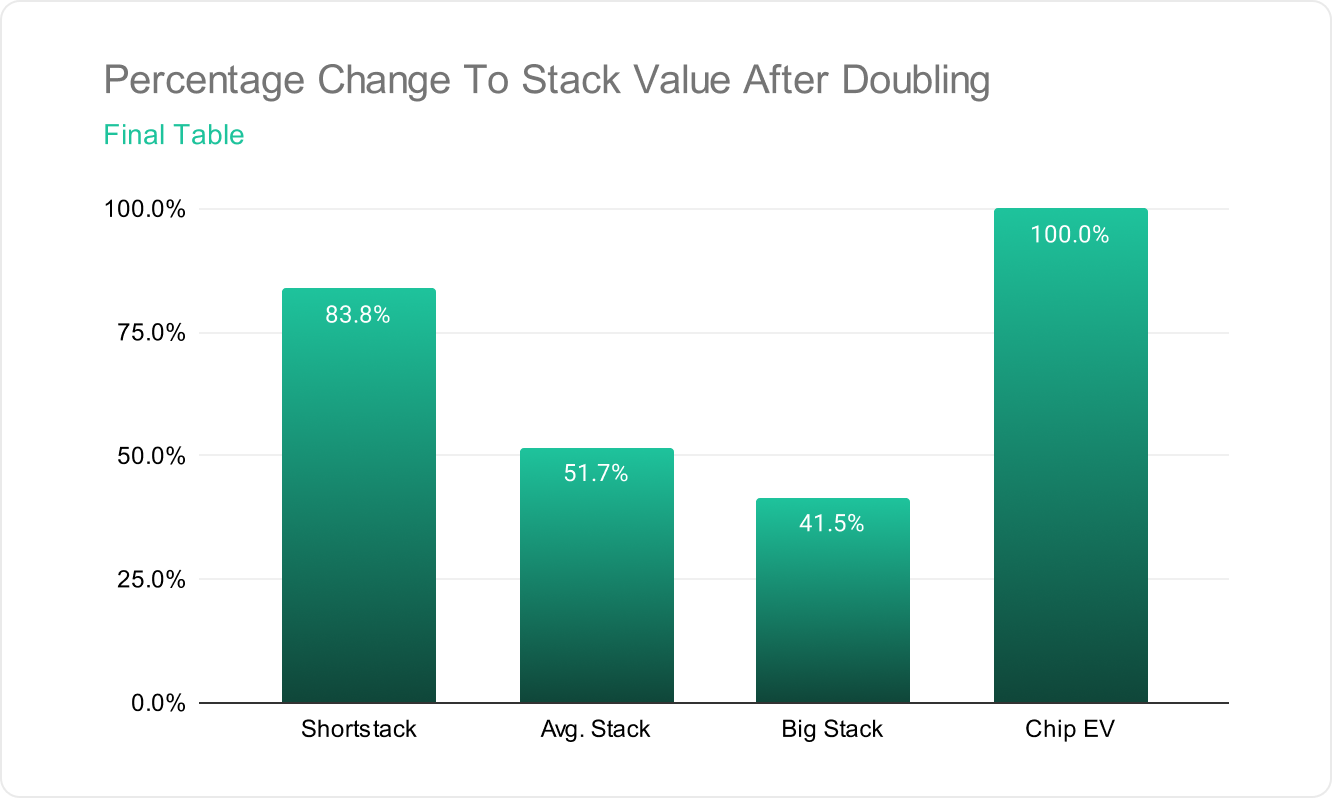
This is the opposite of what happened on the money bubble. The bigger your stack, the less you have to gain from doubling up.
The Big Stacks Have More To Lose at Final Tables
What is going on here? Why does ICM pressure almost flip around?
The essence of it is that the medium and big stacks have more to lose!
Our medium stack had $5,704.72 equity, which is essentially 4th place money. If they punted, they would not only be throwing away that particular prize but also their chance of coming first, second, third, and so on.
The other significant factor here is that the upside of the bigger stacks is capped. No matter how many more chips they win, they cannot win a bigger prize than the first prize ($15,190). When our chip leader had 40% of the chips in play, their tournament equity was $11,079.23. Even when I gave them 99% of the chips, their equity only went up to $15,147.43. There is just less upside to justify taking a big risk.

However, when we contrast that with the short stack, there is a lot of upside to doubling up. They have already secured themselves the 10th place prize ($1,020). So, there is no risk of going broke in that regard, but doubling up harbors a great reward (worth an 84% equity increase). Don’t get me wrong, though. They still have ICM pressure on them, but relative to the bigger stacks, they have “nothing” to lose and “everything” to gain.
Small vs Large Field Money Bubbles
One category of spots where the above is not quite true is when the money bubble is in a small field event.
In the following two spots, the chip distribution on the table is identical.
Impact of Field Size on Money Bubble Factors
This is the money bubble in a tournament with 1,000 runners (150 paid), with the following bubble factors:
This is the same spot, but the money bubble takes place in a tournament with 200 runners (30 paid):
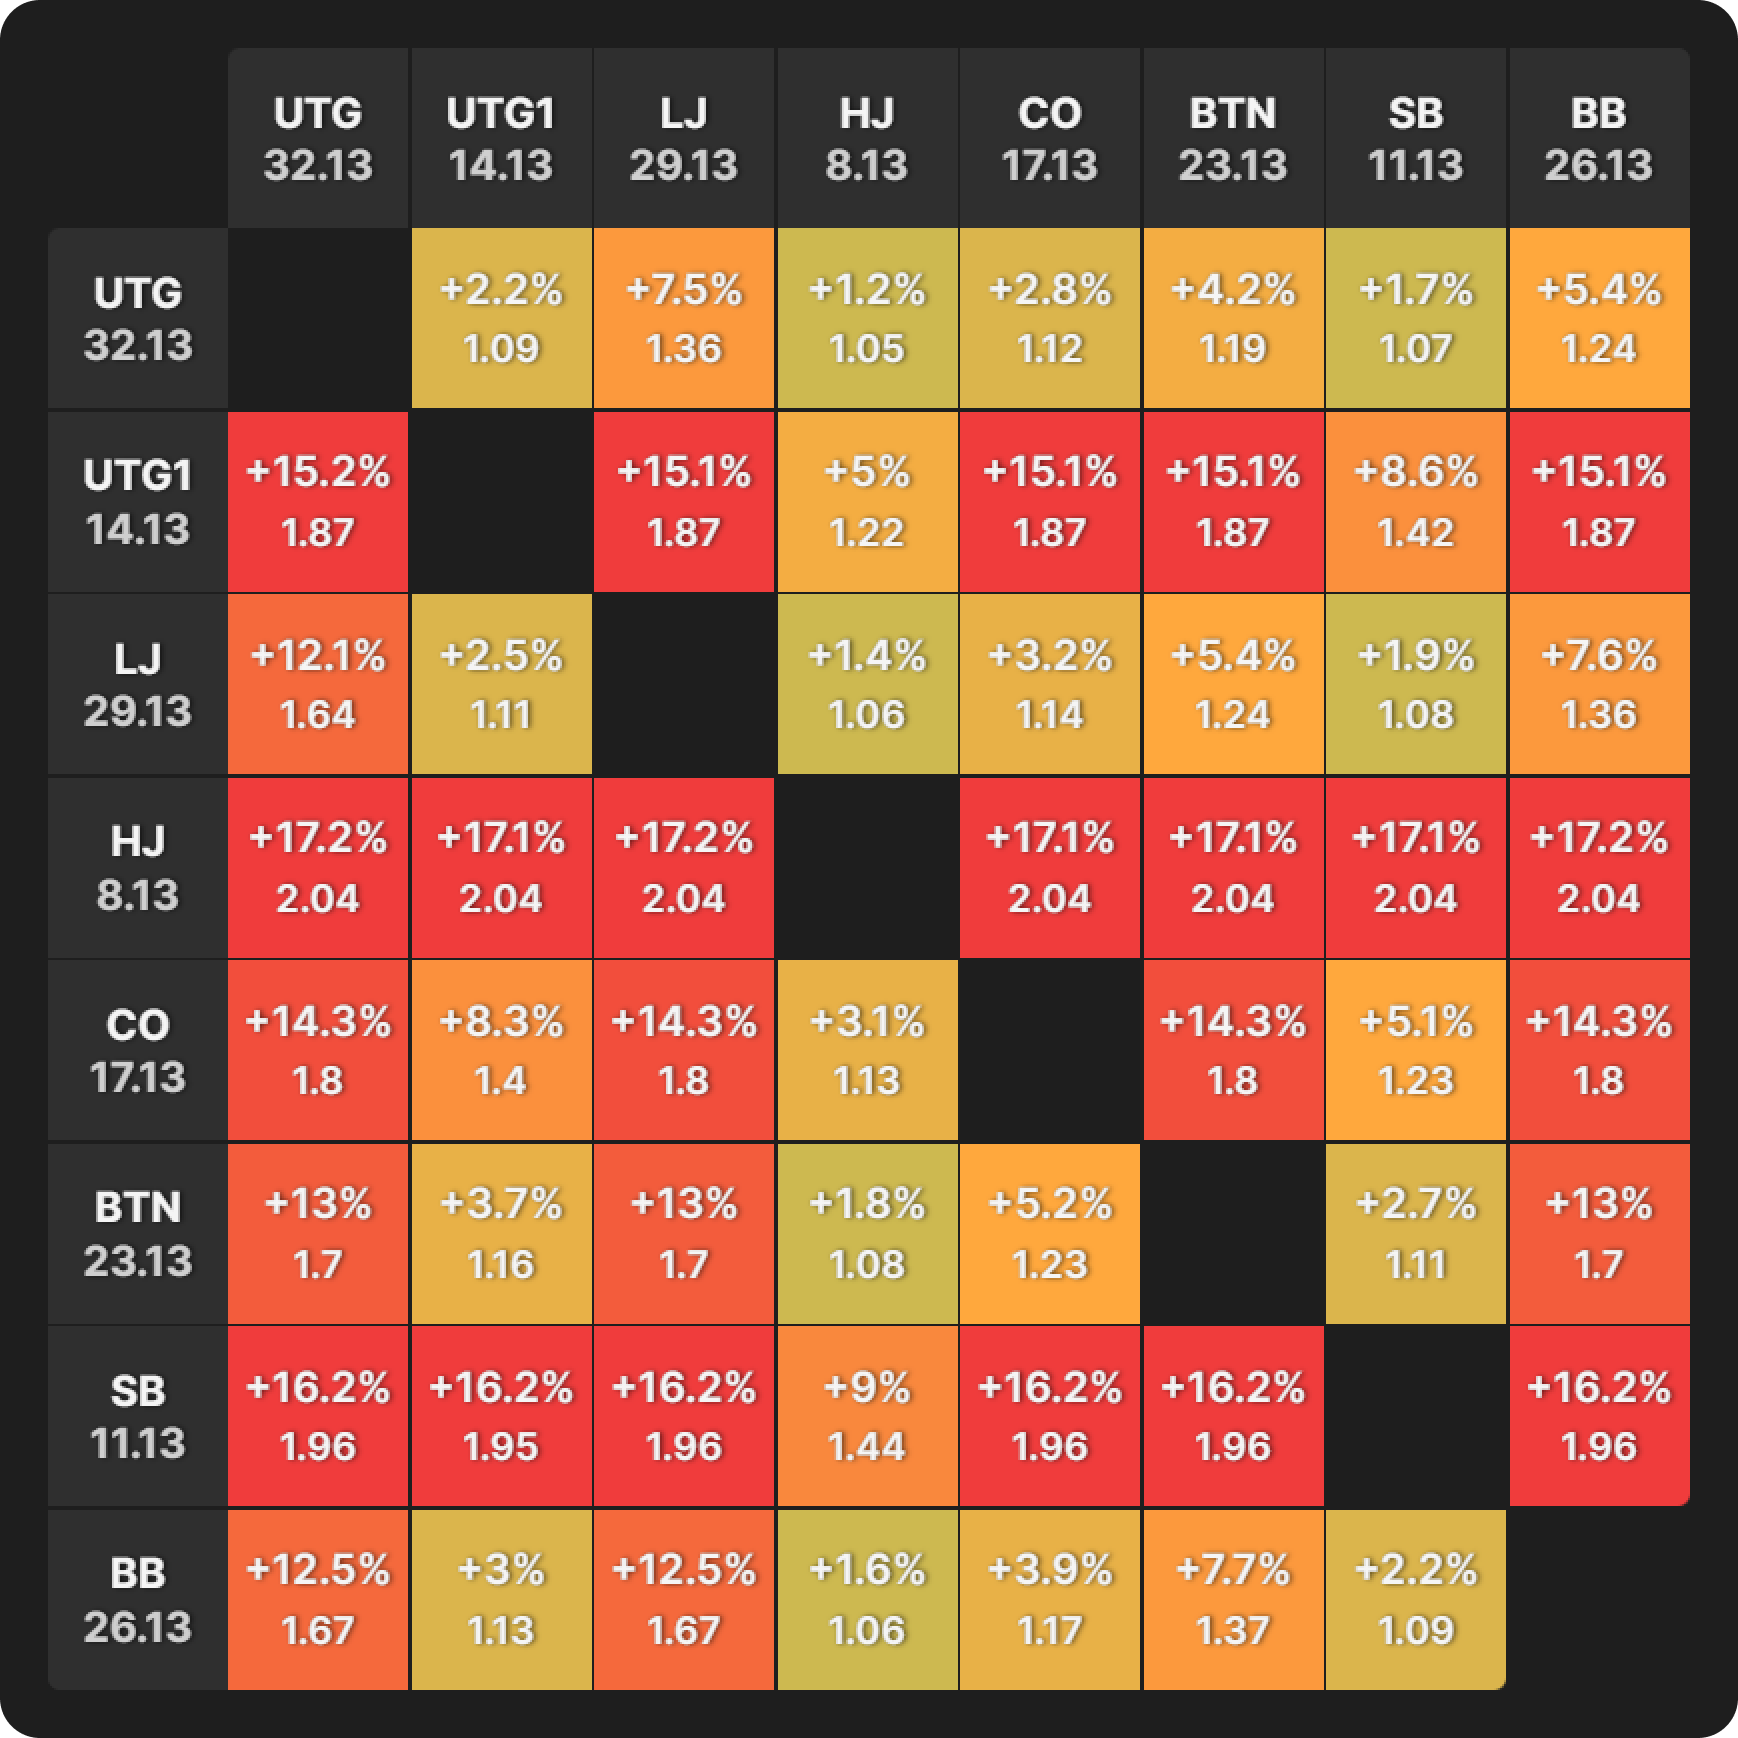
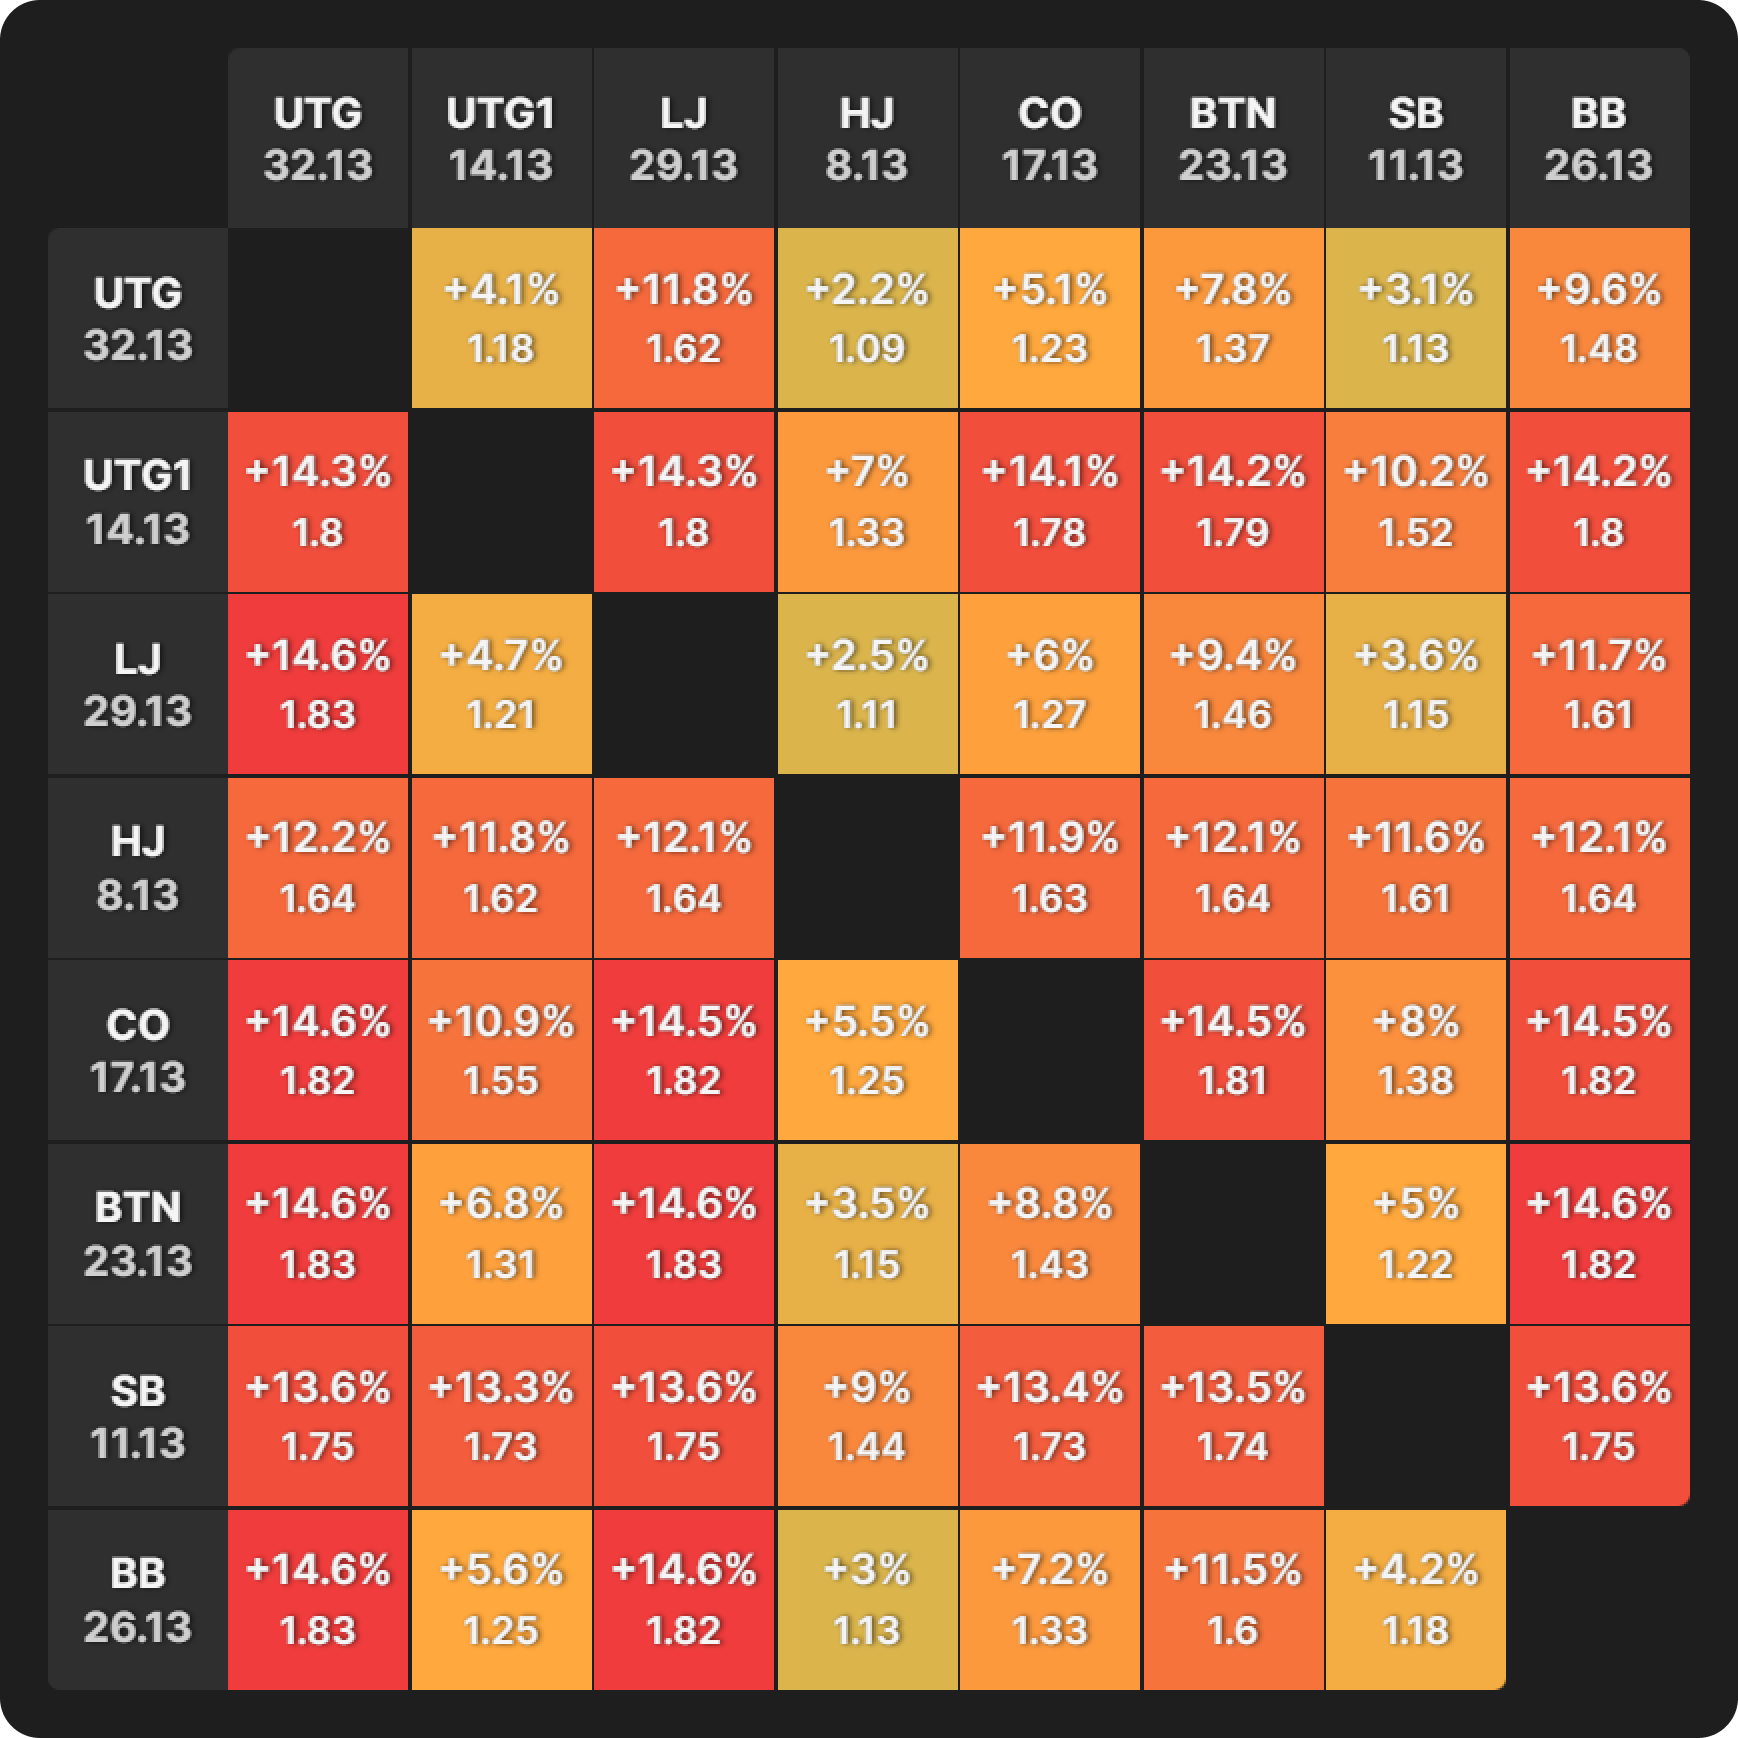
At first glance, they look quite similar. However, further inspection of our short stack (the HJ with 8bb) reveals a nuance. In the 1,000-runner example, their bubble factor is 2.04 across the board, the highest at the table. In the 200-runner example, their bubble factor lowered to 1.64 in most spots.
The BTN is the middle stack with 23bb. Their bubble factor peaks at 1.7 in the 1,000-runner example but goes as high as 1.83 in the 200-runner scenario. This is the highest bubble factor of all.
The chip leader is UTG with 32bb. Their bubble factor gets as high as 1.36 in the 1,000-runner example, it goes as high as 1.62 in the 200-runner scenario.
In a smaller field, the money bubble looks much more like the final table bubble.
In practical terms, this means that the short stacks can play looser, while the medium to large stacks have to play more cautiously.
This effect on the strategies is caused by the money bubble occurring much closer to the final table bubble. Reaching the final table is a much more likely prospect for everyone in a small-field tournament than in a big-field MTT. The short stacks, therefore, have less of their equity tied up in the min-cash.
Conclusion
The money and final table bubbles are the two most extreme ICM situations in a classic tournament. They are similar in severity but different in who experiences the most pressure.
Money Bubble
The money bubble puts the most pressure on short stacks, for whom making the money is usually their only realistic prospect. Larger stacks should not concern themselves as much about min-cashing because they do have a realistic shot of making the final table and its prizes.
Final Table Bubble
The final table bubble is the opposite. A medium to large stack is most pressurized because they have “everything” to lose and much less to gain by taking a big risk on the FT bubble. A short stack, however, has a lot to gain by taking some risks. There is much more upside for the short stacks on final table bubbles.
Field size is a massive consideration in this respect. On money bubbles, the closer everyone already is to the final table, the closer the strategy resembles a final table bubble.
The BB’s incentives for calling an SB preflop raise differ from those of a cold-caller facing a raise from, say, LJ or CO. And the SB’s incentives for raising differ from those of an open-raiser in any other position.

Author
Barry Carter
Barry Carter has been a poker writer for 16 years. He is the co-author of six poker books, including The Mental Game of Poker, Endgame Poker Strategy: The ICM Book, and GTO Poker Simplified.
Wizards, you don’t want to miss out on ‘Daily Dose of GTO,’ it’s the most valuable freeroll of the year!

We Are Hiring
We are looking for remarkable individuals to join us in our quest to build the next-generation poker training ecosystem. If you are passionate, dedicated, and driven to excel, we want to hear from you. Join us in redefining how poker is being studied.
Latest article

The Case for the Hero Check: Why Great Players Know When Not to Bet
In this era of game theory and solvers and poker games running at a huge…

What’s Your Hand Worth? From Thin Value to Playing for Stacks
Poker theory offers many conceptual tools for answering the question, “What is your hand worth?”…

Tournament Poker’s Hidden Stakes
In this era of game theory and solvers and poker games running at a huge…

Top GTO Wizard Features the Pros Prioritize (and What They Leave Out)
In this roundtable series, I have been asking GTO Wizard content creators about some of…

How To Prep Like a Pro for WSOP
The World Series of Poker (WSOP) is one of the most recognized tournament series in…

Cold-Calling in Straddle + Ante Games
In traditional no-limit Hold‘em cash games, calling an open-raise is rarely appealing unless you are…

Roundtable: Aha! Moments in GTO Wizard
Understanding solver technology is very challenging. You not only have to grapple with the technology…

Poker: The Battle for Information
Poker is sometimes described as a battle for information, and there is much truth in…

How To Construct a Squeezing Range
As is often the case with my articles for this blog, what I am writing…

Opening From the Blinds in Straddle + Ante Games
Opening From the Blinds in Straddle + Ante Games No-limit Hold‘em has not traditionally been…

When To Just Shove Post Flop in ICM Spots
When To Just Shove Post Flop in ICM Spots The general trend for bet sizing,…

The Theory of Bounty Tournaments – Part 3: Key Calculations
Parts 1 and 2 in this bounty theory series describe how total risk premiums are…

The Learning System That Separates the Best From the Rest
As an avid strategy game enthusiast, I’ve spent a large portion of my life trying…

The Fish Were Right All Along
In a recent conversation with Andrew Brokos, he made the comment, “The fish were onto…

How to Use Practice Mode in GTO Wizard to Improve Your Game
GTO Wizard provides a wide variety of tools to help you become a better player,…

Should You Ever Bluff with a Pair?
Turning a made hand into a bluff might initially sound counterintuitive. In the pre-solver days,…

ICM Strategy: Playing IP Against the Chip Leader on the Final Table
The good news is you’ve made the final table (FT). Better yet, you’ve made it…

ICM Survival Guide: How To Play OOP vs. a Covering Stack at the Final Table
Contesting a pot against a player who covers you at a final table (FT) is…

We’re At The River. Our Hand Can’t Win. Now What?
You’re in a heads-up pot and you’ve made it to the river. Your opponent has…

When Is Bluffing Profitable? The Key Factors You Need to Know
When is bluffing profitable? When you expect your opponent to fold! That’s not a joke,…

Blockers & Unblockers: The Secret to Picking Great Bluffs
Blocker/unblocker was a concept my coach, Dara O’Kearney, showed me in relation to bluffs. It…

The Art of Game Selection for MTTs: Finding Soft Fields & Extra Value
Game selection is not something immediately associated with tournaments because the seat draw is random.…

How To Get the Most out of Your Hand Reviews
I don’t spend much of my study time checking whether specific hands I played are…

The Art of Turn Probing: Exploiting Checked Flops
After calling a 3-bet as the out of position (OOP) player, you should expect to…

How To Respond to Large Preflop Raises in Poker
Solver-derived preflop charts for both cash games and tournaments have historically assumed small raises on…

Mastering Postflop ICM: Avoid These Common Mistakes
The new postflop ICM feature from GTO Wizard is a game changer. Previous incarnations of…

What Happens When Playing Chip EV and ICM Is Significant
Just how costly is it to play a Chip EV style when ICM is significant?…

How To Become a Winning Poker Player in 2025 – Part 2
Welcome back to part 2 of our series on how to become a winning poker…

How To Become a Winning Poker Player in 2025 – Part 1
I fell in love with the game of poker when I saw the best players…

IP 4-Betting in Deep-Stacked Cash Games
4-betting in position (IP) is a totally different phenomenon from 4-betting out of position (OOP).…

OOP 4-Betting in Deep-Stacked Cash Games
4-bet pots (4BP) can be scary because the stakes are high, but with 100bb stacks,…

Fixing a Poker Leak Part 2: The Mental Game
In the first part of my series on fixing leaks, I looked at the many…

Fixing a Poker Leak Part 1: Spotting and Correcting Errors
In this two-part series, I am going to look at how we can identify and…

How Significant Is ICM During Late Registration?
One of the many valuable aspects of GTO Wizard’s new postflop ICM feature is that…

The Many Faces of Balance in Poker
When you think of balance in poker, what comes to mind? Most likely, you were…

Unwrapping GTO Wizard’s Hidden Gems for 2025
A new year is upon us, which is classically the time that most people start…

The Theory of Bounty Tournaments – Part 2: ICM and Equity Drops
In part 1 of “Introduction to Bounty Theory,” we analyzed how the structures of bounty…

The Theory of Bounty Tournaments – Part 1: Prize Pool Fundamentals
Bounties are a significant new variable to take into account when studying tournament theory and…

Responding to Donk-Bets at Final Tables
It’s scary to contest a pot against a covering stack when you have a high…

Donk-Betting As the Covering Stack in MTTs
Tournament poker generally incentivizes stack preservation and more conservative play than cash game poker, and…

Dominate the River in 3-Bet Pots OOP
Playing the river may seem scary. Pots, on average, have been swelling up big time…

Exploiting BBs Who Never Donk-Bet
In a single-raised pot (SRP), a BB caller should almost always check when out of…

Picking the Right Semi-Bluffs
As I often like to remind readers, I am not a professional poker player; I…

Playing Calls From the Button in Cash Games
When first beginning to study cash game poker strategy, there is a common refrain that…

Bringing It All Together: PKO Review
Throughout the past year, our writers have presented nine unique articles and videos outlining how…

What Factors Impact Ranges the Most in PKOs?
In our article “How Does ICM Impact PKO Strategy?“, we contrasted how PKO and Classic…

PKO vs Classic: Postflop Play
In our previous articles comparing PKO and Classic tournaments, we reviewed how to adapt our…

How Do Bounties Impact Our Flop Ranges When Covering?
The previous articles in our PKO series showed how preflop ranges that are adjusted for…

Short Stack Stealing on the Bubble
Open-raising on the bubble into players who cover you is scary. Savvy opponents will recognize…

Maximizing Monsters in Deep-Stacked Scenarios
Why did Dracula quit the game when Wolfman insisted on a mandatory straddle? — Why?…

Confronting Monsters Under the Bed in Poker
Do you hide from things that go bump in the night? Does the sight of…

Bullying the Blinds With Continuation Bets
A big stack in No Limit Hold‘em does not always carry a license to steal.…

A Comprehensive Guide to Playing Satelites
One of the most important inventions in poker that contributed to the growth of the…

A Comprehensive Guide to Playing Mystery Bounties
The Mystery Bounty format looked like a novelty event at first, but swiftly became a…

Leading Hands That Should Check-Call
The most consistent leak I have encountered live and online, and at a variety of…

Mastering Turn Play in 3-Bet Pots OOP
Playing the flop OOP in a 3-bet pot can be challenging. Turn play, however, is…

PKO Versus Classic: Responding to 3-Bets
One of the keys to adapting to new game formats, such as Progressive Knockout (PKO)…

PKO Versus Classic: Responding to a Preflop Open
One of the keys to adapting to new game formats, such as Progressive Knockout (PKO)…

Preflop Range Morphology
Morphology in poker is the study of shapes/forms of ranges. This domain of poker study…

The Five Imbalances of Exploitative Poker
One of the great modern debates in poker is GTO vs Exploitative strategy. It can…

PKO Versus Classic: Preflop RFI Range Comparisons
One of the keys to adapting to new game formats, such as Progressive Knockout (PKO)…

Why So Much? An Exploration of Larger-Than-Geometric Bet Sizing
Via toy games, it is easy to demonstrate that a player betting a perfectly polarized…

Slow-Playing
Slow-playing, like running a big bluff or making a heroic call, feels great when it…

MDF vs ICM: Rethinking Bluffing & Defense Strategies in MTTs
Minimum Defense Frequency (MDF) is, strictly speaking, the calling (and/or raising) frequency that makes your…

The Magic of Equity Buckets
One of the most daunting aspects of learning the modern game of poker, especially with…

Preflop Strategy in Straddled Pots
Many games allow “straddles,” where a player who is not in the blinds voluntarily posts…

The 5 Levels of Trainer Mastery for MTTs
Studying poker can be a challenge to both new and seasoned players. Tournament poker, in…

4-Bet Pots OOP as the Preflop Caller
4-bet pots are often uncomfortable to play. Some of the reasons include: — A lot…

Bounty Models Explained: Solving Knockout Tournaments
We’ve just rolled out a revolutionary update! You can now find optimal postflop ICM strategies…

Theoretical Breakthroughs in ICM
Today, we’ll share one of the most significant theoretical breakthroughs in tournament poker since the…

The Limitations of Nash Equilibrium in ICM Spots
In the complex world of poker tournaments, the Independent Chip Model (ICM) plays a pivotal…

Rake & Rakeback Explained: Optimize Your Poker Earnings
Rake is one of the main things that allows poker to distinguish itself as a…

From Gutshots to Airballs: Choosing Your Bluffs
Whenever you’re running a bluff, it’s reassuring to have a backup plan like some draw…

Crush 3-Bet Pots OOP in Cash Games
Did you know that 3-bet pots out of position (OOP) as the preflop aggressor make…

The Math of Multi-Street Bluffs
Bluffing is a fundamental skill in poker, blending deception with strategic calculation to sway the…

The Mechanics of C-Bet Sizing
What factors influence c-bet sizing on the flop? Is it fold equity, SPR, draw equity,…

Poker Insurance: Reducing Variance or Wasting Money?
Variance is what makes poker great. Without it, recreational players would not keep playing. Most…

Money Bubble vs Final Table Bubble
Is one bubble the same as another? Should we play more conservatively on the money…

Facing 3-Bets From Covering Stacks at the Final Table
The last thing you want when you have a nice stack at the final table…

Poker Staking Essentials
One of the great ‘through the looking glass’ moments for any poker player is when…
 That Harm Your Poker Study")
A Poker Player’s Guide to Conquering Cognitive Biases – Part 2
In the past, I’ve written about gambling biases that can affect how you play and…

The 5 Levels of Trainer Mastery for Cash Games
We’ve created over 40 custom drills for this article! Though all drills are accessible through…

How To Review ICM Preflop Ranges
In a sense, tournaments could be considered the more complex format compared to cash games.…

Calling Down Over-Bluffed Lines in Lower Limits
If you are playing low stakes, chances are you have a plummeting red line in…

A Poker Player’s Guide to Conquering Cognitive Biases – Part 1
In my article on confirmation bias, I mentioned that there are many cognitive biases and…

Exploiting Cold Callers Who Stab Too Much
In single-raised pots (SRPs) between an in position (IP) raiser and an out of position…

Using the 80/20 Rule in Poker
The Pareto principle, or the ‘80/20 Rule’, is an economic theory that, when you learn…

Attacking Aggressive Opponents When They Check Back Flop
Playing out of position (OOP) is hard. Playing out of position against an aggressive opponent…

Buying the Showdown
This article was inspired by Mark, who submitted a question to my podcast about a…

Barreling as IP Cold-Caller
You cold-called a preflop raise. That’s scary. You bet into a check from the preflop…

How Confirmation Bias Impacts Poker Study
There are a great number of cognitive biases, mental models, and heuristics that I plan…

A Champion’s Guide to Knockout Poker Formats
If you’ve opened any online poker client recently you will have seen an explosion of…

Pushing Equity With Small Bets
One of the most memorable pieces of poker wisdom I ever received came from my…

Turn Check-Raise Heuristics
Dealing with turn aggression is an area many players find difficult, which is an excellent…

Aggregate Flop Strategy: SB C-Betting in SRP
Continuation betting from the SB does not follow the usual patterns for out of position…

The Power of the Hypergeometric Bet
What size should we bet with our value and bluffs? When our range is perfectly…

The Limits of Nodelocking
GTO Wizard’s nodelocking feature is where the theory meets the practical; you can study how…

Limp-Called Pot as BB
My favorite way to study with GTO Wizard is to approach it experimentally, using the…

Why Not Shove?
You’re in the money in an MTT but still a long way from the final…

What We Can Learn From Outlier Hands
The worst way to use a tool like GTO Wizard is to simply ‘line-check’ how…

Building Exploits From Showdown
Understanding how and when to exploit opponents at a live poker table is a delicate…

Navigating Nasty Rivers Out of Position
Playing out of position (OOP) is hard. It’s fundamentally disadvantageous to act on each street…

Crack the Shell of Nut Draw Strategy
Nut draws hold obvious appeal as betting and raising candidates. They benefit from fold equity,…

Preflop Raise Sizing: Examining 2 Key Factors
It amazes me that, after nearly twenty years of playing no-limit hold ‘em professionally, I…

How to Handle Loose-Passive Limpers
Solver charts and presolved solutions do not offer much in the way of explicit guidance…

Top 5 Mistakes in Spin & Gos
As a Spin and Go poker coach, I regularly encounter common mistakes that players make,…

An Introduction to Spin & Gos
I was playing Tournaments for the first decade of my career. But after my first…

Relationships and Poker
In my more than 15 years of poker coaching, I’ve helped hundreds of clients improve…

Do Multiple Sizes Matter?
Should I work out the other tools or just stick to the crowbar? Solver results…

The Science of Learning Applied to GTO Wizard
The way we were taught to study in schools was flawed and has negatively impacted…

Check-Raising a Single Pair
In this article, I will address a question raised by Twitter/X user ’Matt Riley’, who…

The Turn Probe Bet
Imagine yourself defending as the BB caller vs BTN preflop raiser in a 100bb cash…

When To Encourage Multiway Pots in PKOs
I was recently shown this fascinating PKO hand from the GTO Wizard PKO library. Somebody…

Protect Equity and Prosper
When we think about the best hands to bet in a given situation, we tend…

Do Solvers Have Targets?
Targeting has long been a staple of exploitative poker thinking. When you’re value betting against…

Disciplining Big Blind in Limped Pots
When the BTN open-limps off a short stack, the postflop play against the BB should…

I’d Rather Be Drawing
Which is the better hand on a K♥8♦5♦ flop: K♠T♣ or 7♥6♥? OK, I’ll admit…

The Curious Case of Open-Limping Buttons
Before the advent of solvers, open-limping was considered the province of passive, gambley recreational players…

Cleaning Out Sticky IP Callers
A “sticky” player on your left, one who calls your preflop raises too often and…

Defending Against Tiny 3-Bets
Tournament poker is about precision. Cash games, where stacks typically run into the hundreds of…

Heads up! Exploiting SB’s Preflop Mistakes
Heads up (HU) tournament play presents unique challenges to the average player. Many tournament players,…

C-Betting As the OOP Preflop Raiser
Position is an extremely valuable advantage in poker. Most players would describe the comfort zone…

Overchoice: Making Sense of Multiple Sizings
Solver solutions with multiple bet sizes often involve a lot of mixing between those sizes,…

River Refinements: When Your Opponent Won’t Check-Raise
One of the biggest strategic differences between playing in versus out of position involves betting…

Turn Barreling in 3-Bet Pots
There are two articles on the GTO Wizard blog that make good prerequisites to this…

The Right Way To Think About Protection
Suppose Paul the Protector is in a 200bb cash game and opens A♠A♣ in the…

The Importance of Board Coverage
The first public version of the GTO Wizard announced AI upgrade already has some useful…

How To Adjust When Villain Has No Bluffs
“They always have it!” is a common, semi-joking expression in poker to describe the tendency…

Adjusting on Later Streets After Exploiting Flop
The key to exploiting opponents profitably is knowing when to stop. I’m not referring to…

C-Betting IP vs Passive Poker Players
A preflop raiser enjoys a significant range advantage over a BB caller, enabling them to…

C-Betting Against ICM Preflop Ranges
You raise from early position (EP) in a multi-table tournament and the BB calls. Both…

The Art of Bluff Catching
Bluff catching—calling a bet with a modest hand which you expect to win only if…

Exploiting Excessive C-Betting by IP
On some flops, it is simply not possible for the preflop raiser to continuation bet…

Is Limping Pimping?
In a past Discord post, one of our members noted that an upside of implementing…

Exploiting Excessive C-Betting by OOP
A preflop raiser who continuation bets too often is always a potential target for exploitation,…

Preflop Button Mastery in PKOs
Playing from the Button presents many unique opportunities in any tournament format, especially in PKOs.…

The Worst Turn Card
Greetings from GTO land. In today’s article, we will use the Turn Reports feature to…

Navigating Range Disadvantage as the 3-Bettor
Picture this: We’re playing a NL500 6-max cash game, and we’ve won a few pots,…

Mastering Three-Bet Pots In Position in MTTs
Playing in position against a three-better is a lesson in playing to your advantages. As…

Mastering Three-Bet Pots Out of Position in MTTs
Three-bet pots are scary. Playing out of position is scary. Put them together, and you’ve…

The Greatest Final Table in Triton History
Today, we’ll examine one of the most epic final table battles I’ve ever witnessed! Our…

Mastering Thin Value Bets in Checked-Down Pots
Valuing your hand appropriately—determining whether it’s strong enough to value bet or so weak you…

Maximizing Value on Monotone Flops
Monotone flops tend to provoke great anxiety among poker players. It’s easy to imagine that…

How to Defend Against Turn Donk Bets
Responding effectively to donk bets on the turn is tricky;, there’s no getting around that.…

How and Why You Should Use Turn Donk Bets
Donk betting–taking the betting lead away from the previous street’s aggressor–on the flop is rarely…

How Stack Sizes Change Your Range
In this series, we have looked at factors that can influence ranges in otherwise identical…

How to Leverage GTO Wizard’s EV Comparison Tool
With the advent of solvers, some troubling new turns of phrase have entered the poker…

Should You Ever Cold Call a 3-Bet?
When there’s been a raise and re-raise before the action is on you, you will…

When ICM Breaks Down
If you have read my previous GTO Wizard articles and my books, you’ll know I…

When Is It Correct To Fold AA Preflop?
One of the criticisms of ICM is that it is boring and robotic. In my…

OOP C-betting vs Loose Cold-callers
In a previous GTO Wizard article, I asserted that “Playing against an in-position cold-caller is…

Short-Stacked Play in MTTs
Playing a short stack well is an essential tournament skill. It is extremely rare to…

When To Ladder in Tournaments
In my last two articles, I wrote about the effect field size and payout structure…

How Payout Structures Impact ICM
Last time we discussed the ICM considerations in game selection, we looked at field size,…

C-Betting IP in 3-Bet Pots
When you three-bet before the flop and the original raiser calls from out of position,…

C-Betting OOP in 3-Bet Pots
Continuation betting from out of position can be a dicey proposition in single-raised pots. Cold…

Dynamic Sizing: A GTO Breakthrough
Dynamic Sizing is a revolutionary new poker algorithm that automatically simplifies your strategy with the…

Dynamic Sizing Benchmarks
Dynamic Sizing is a revolutionary new poker algorithm that automatically simplifies your strategy with the…

Understanding The Impact Of Field Size On ICM In Poker
When people talk about game selection in multi-table tournaments (MTTs), they invariably talk about the…

Defending vs BB Check-Raise on Paired Flops
This is a companion piece to Attacking Paired Flops from the BB; you will get…

Mastering PKO Final Tables
Final tables can be the most exciting and rewarding phase of a tournament, and being…

Attacking Paired Flops From the BB
Paired flops present unique challenges to both a preflop raiser and a BB caller. The…

KK vs QQ vs JJ at WSOP Main Event
With only fourteen players remaining in the 2023 WSOP Main Event and blinds of 400K/800K/800K,…

Responding to BB Squeezes
You open raise, someone calls, and the BB squeezes. How should you construct your strategy?…

Crushing a Top HUNL Poker Bot
In 2022, Philippe Beardsell and Marc-Antoine Provost, a team of Canadian programmers from Quebec, developed…

GTO Wizard AI Explained
We are excited to introduce GTO Wizard AI, formerly known as Ruse, the world’s best…

GTO Wizard AI Benchmarks
GTO Wizard has combined the power of artificial intelligence with traditional solving methods to bring…

Table Management in PKOs
Perhaps the most important strategic consideration in Progressive Knockout Tournaments (PKOs) is making sure you…

Overcalling From the BB
In poker, overcalling refers to calling a bet or raise after another player has also…

Understanding Which Mistakes Cost You the Most Money
I am fortunate enough to have worked for many years with the mental game coach…

Overbetting The Flop in Cash Games
Although most commonly analyzed on turns and rivers, flop overbetting can be a devastating weapon…

Using New Skills at the Poker Table
How many times has it happened to you that you make a mistake only to…

Flatting Ace-X Hands Shortstacked
Playing out of position is tricky, but it’s an essential part of tournament play. With…

Playing Limped Pots as the BB in MTTs
Success as the BB in limped pots begins before the flop. The BB’s equilibrium strategy…

The Absurd Game Theory of Chopped Boards
A “chopped board” in poker is one where the community cards make up the best…

Playing Limped Pots as the SB in MTTs
MTT confrontations between the small blind and big blind force no-limit players into uncomfortable situations,…

The Art of Learning Poker
In his book The Art of Learning, chess and Push Hands champion Josh Waitzkin describes…

Is Donk Betting for Donkeys?
“Donk betting”, or betting from out of position into the player who was the aggressor…

Delayed C-Betting
This is a companion piece to Probe Betting. It stands on its own, but understanding…

Probe Betting
As far as rules of thumb go in poker, “check to the raiser” is a…

ICM and Blind Battles: The Big Blind
This is a companion piece to this article on the SB’s strategy for blind vs…

ICM and Blind Battles: The Small Blind
ICM incentivizes more conservative play, which means that at stages of the tournament where risk…

The Initial Bettor’s Advantage
The mathematics of poker holds a little-known secret: the first bettor enjoys better bluffing odds…

Mastering the Chiplead: The Scalpel and the Sledgehammer
When you have a lot of chips at a final table or in another situation…

Flop Heuristics: IP C-Betting in Cash Games
Our never-ending quest for money and fame leads us to the flop. We open the…

How ICM Impacts Restealing From The Blinds
When I first started working with preflop solves, one of the features I found most…

The ICM Benefits of Late Registration in Poker Tournaments
Why do so many professional poker players register late for tournaments when they clearly would…

Flop Heuristics: OOP C-Betting in MTTs
Playing against an in-position cold-caller is dramatically different–and dramatically more difficult–than playing against a caller…

Counterintuitive Calls
Solver outputs such as those provided by GTO Wizard are models of no-limit hold ‘em,…

How To Negotiate Final Table Deals
Most people’s first introduction to the Independent Chip Model (ICM) is not from studying bubble…

How Does ICM Impact PKO Strategy?
If you have read The Theory of Progressive Knockout Tournaments you already know why we…

Understanding Blockers in Poker
Often when looking through a solver’s meticulously crafted grid of deception, one of the following…

Flop Heuristics: IP Cold-Caller in MTTs
A Cold-call refers to the act of calling a preflop raise when you don’t close…

Flop Heuristics: IP C-Betting in MTTs
In the world of poker, the flop is a crucial stage of the game that…

Flop Heuristics for Defending the Blinds in MTTs
The field of Game Theoretically Optimal poker is extensive, and thus, to simplify our strategy,…

Multiway strategy in Progressive Knockout Tournaments
Progressive Knockout (PKO) tournaments are much more complex than traditional MTTs. The fact that players…

How To Calculate Raises In Poker
One of the most frequently asked questions in poker is how to calculate the size…

Principles of River Play
The river offers the least complicated strategy of any betting street. With no further cards…

Exploitative Dynamics
GTO solutions are designed to be unexploitable, performing reasonably well no matter how your opponents…

How ICM Impacts Postflop Strategy
Most players understand how the Independent Chip Model (ICM) in poker impacts their strategy preflop,…

10 Tips for Multiway Pots in Poker
While lots of work has been placed into research and explanation of heads-up pot strategy,…

What is the Bubble Factor in poker tournaments?
The Independent Chip Model (ICM) shows us the real money implications of tournament chip decisions.…

The Theory of Progressive Knockout Tournaments
In poker, a PKO (Progressive Knockout) tournament is a type of tournament where a portion…

How To Analyze Turn Textures In Poker
Master the art of turn analysis in poker. Understand how the turn card changes the…

Principles of Turn Strategy
Learn the principles of turn strategy in poker and discover what makes the turn unique.…

Poker Strategies: Tournaments vs. Cash Games
Tournament poker is not as different from cash game poker as people sometimes assume. Most…

How Solvers Work
A Game Theory Optimal solver is an algorithm that calculates the best possible poker strategy.…

The Most Powerful Play in Poker
The central strategic implication of stack depth is the question of how much equity a…

When does ICM become significant in MTTs?
The Independent Chip Model (ICM) was invented in 1987 by M. Malmuth and is one…

How to Study GTO Solutions
Tools like GTO Wizard and other solvers should not be used to memorize specific strategies.…

Principles of GTO
Game theory, or GTO (for Game Theoretically Optimal), is best understood not as a rigid…

Interpreting Equity Distributions
GTO Wizard’s range vs range equity distribution graphs are an excellent tool for visualizing which…

What is Leverage in poker?
Leverage refers to the risk of future betting. When you call a bet on the…

Reasons for value betting in poker
You’re probably accustomed to thinking of bets as either value or bluff. In this taxonomy,…

The Science of Poker Performance
Poker is a game of small edges and big swings. Every hand is an investment…

What is Valor in poker?
Can a poker hand be courageous? How does your ability to value bet future streets…

Pot Geometry
“Pot Geometry” refers to betting an equal fraction of the pot on each street, such…

A Beginner’s Guide to Poker Combinatorics
Combinatorics is a fancy term for evaluating the number of possible “combinations” (combos) of any…

Stack-to-pot ratio
Stack-to-pot ratio, or SPR, is a way of measuring how deep the effective stack is…

Equity Realization
In poker jargon, equity expresses how much of the pot a hand will win, on…

Variance and Bankroll Management
Variance and Bankroll Management. Vital Soft Skills for Every Poker Player.

How to Become a GTO Wizard
Welcome to the wonderful world of game theory optimal poker! This article will serve as…

The Three Laws of Indifference
Indifference in poker is one of the most misunderstood concepts. The word “indifference” means that…

Poker subsets and abstractions
An “abstraction” is a way to simplify the game of poker. This game is so…

Mathematical Misconceptions in Poker
Pot Odds and MDF are foundational mathematical formulas in poker.

How to solve toy games
Poker is a complicated game. It’s impossible to calculate GTO strategies on the fly. By…

The Value of Fold Equity – Experiment
The term “fold equity” is ambiguous in the poker community. Firstly, it’s an EV equation,…

MDF & Alpha
MDF & Alpha. Minimum Defense Frequency and Alpha are metrics on poker that determine how…

What are Pot Odds in poker?
Pot odds are a fundamental calculation in poker. In the simplest terms, pot odds tell…

Does your range affect your strategy?
Advanced players will often tell you that your range affects your strategy.

Visualizing implied odds
Implied odds are the value you expect to gain over and above your raw equity.…

ICM Basics
As a tournament player, you may have heard about the concept of “ICM”, but what…

What is Equity in Poker?
The term “Equity” is ubiquitous throughout poker theory. Equity refers to your chances of winning…

Range Morphology
“Morphology” is the study of form or structure. You’ve probably heard terms thrown around such…

What is Expected Value in Poker?
Expected value (EV) is the most fundamental metric in poker. Every decision you make is…

Why doesn’t my solution match GTO Wizard?
So, you’ve got your own solutions to some spot, compared it to GTO Wizard, and…

Understanding Nash Distance
Understanding Nash Distance. One of the most common questions when studying with solvers is “Why…

Combinatorics Poker Puzzle
Today we have a special puzzle for you that will test your intuition as a…

The 10 Most Important Concepts for New Poker Players
The 10 Most Important Concepts for New Poker Players. Fundamentals are one of the most…

What is GTO in Poker?
The meaning of GTO in poker is Game Theory Optimal. Game theory is a study…

What does GTO aim to achieve?
So what exactly is a GTO strategy? What makes it “unexploitable”? What does it try…